> ## Documentation Index
> Fetch the complete documentation index at: https://openrouter.ai/docs/llms.txt
> Use this file to discover all available pages before exploring further.
# Sentry
> Send traces to Sentry
[Sentry](https://sentry.io) is an application monitoring platform that helps developers identify and fix issues in real-time. With Sentry's AI monitoring capabilities, you can track LLM performance and errors.
## Step 1: Get your Sentry OTLP endpoint and DSN
In Sentry, navigate to your project's SDK setup:
1. Log in to your Sentry account
2. Go to **Settings > Projects > \[Your Project] > SDK Setup > Client Keys (DSN)**
3. Click on the **OpenTelemetry** tab
4. Copy the **OTLP Traces Endpoint** URL (ends with `/v1/traces`)
5. Copy your **DSN** from the same page
## Step 2: Enable Broadcast in OpenRouter
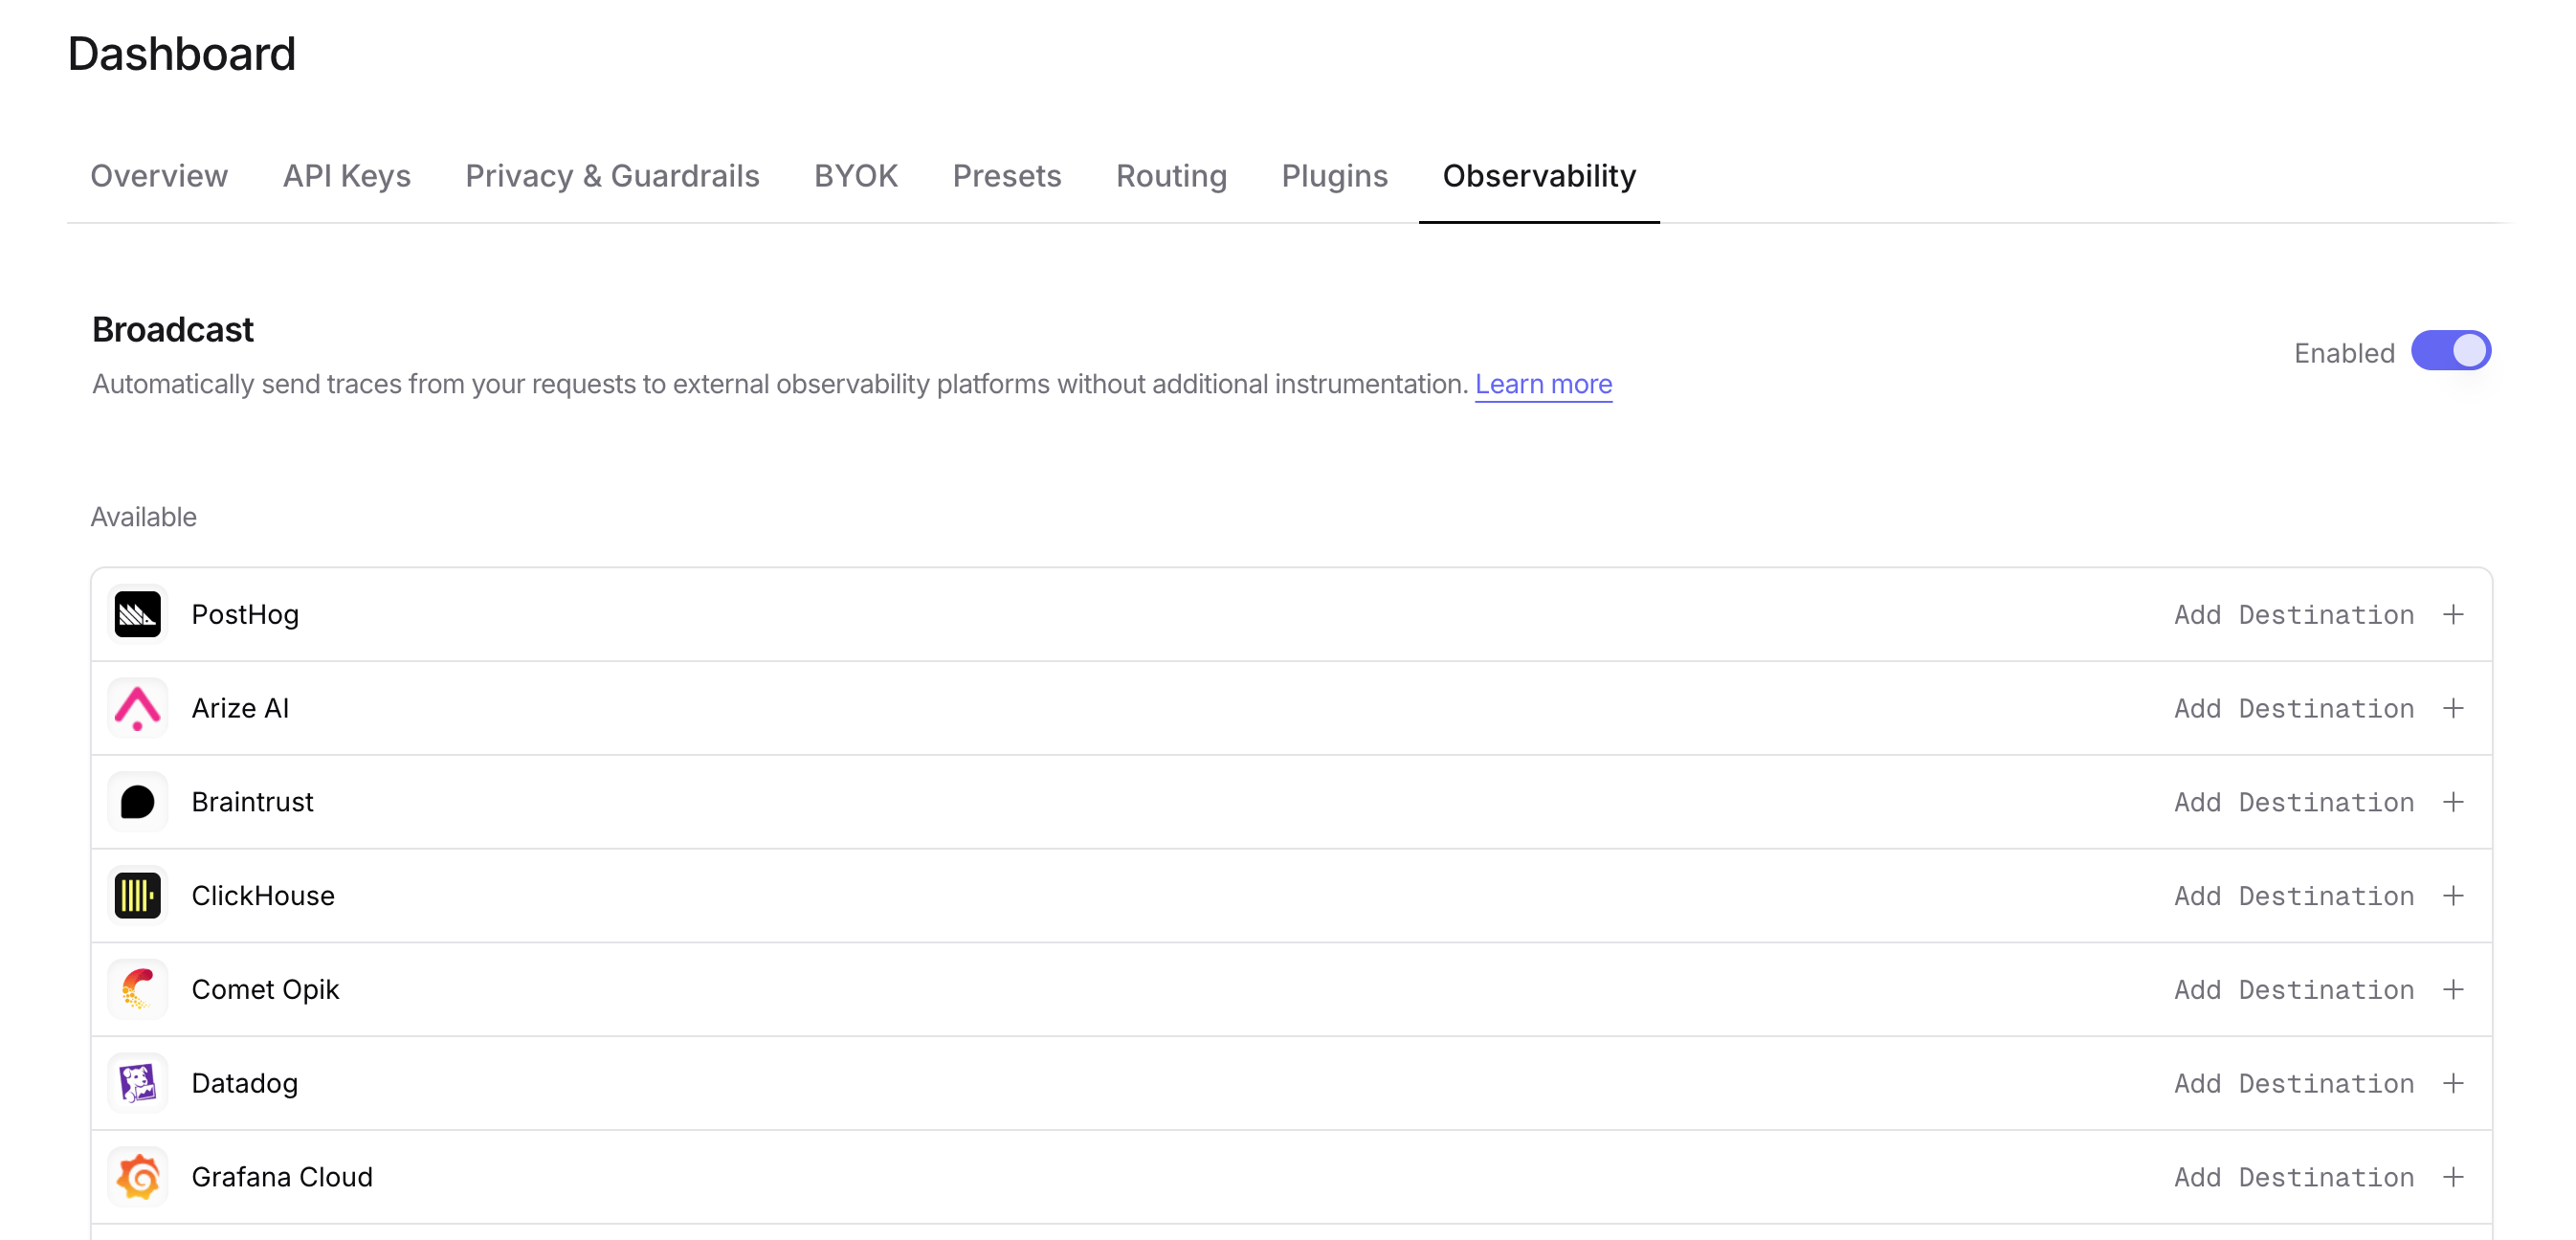
Go to [Settings > Observability](https://openrouter.ai/settings/observability) and toggle **Enable Broadcast**.
 ## Step 3: Configure Sentry
Click the edit icon next to **Sentry** and enter:
* **OTLP Traces Endpoint**: The OTLP endpoint URL from Sentry (e.g., `https://o123.ingest.us.sentry.io/api/456/integration/otlp/v1/traces`)
* **Sentry DSN**: Your Sentry DSN (e.g., `https://abc123@o123.ingest.us.sentry.io/456`)
## Step 4: Test and save
Click **Test Connection** to verify the setup. The configuration only saves if the test passes.
## Step 5: Send a test trace
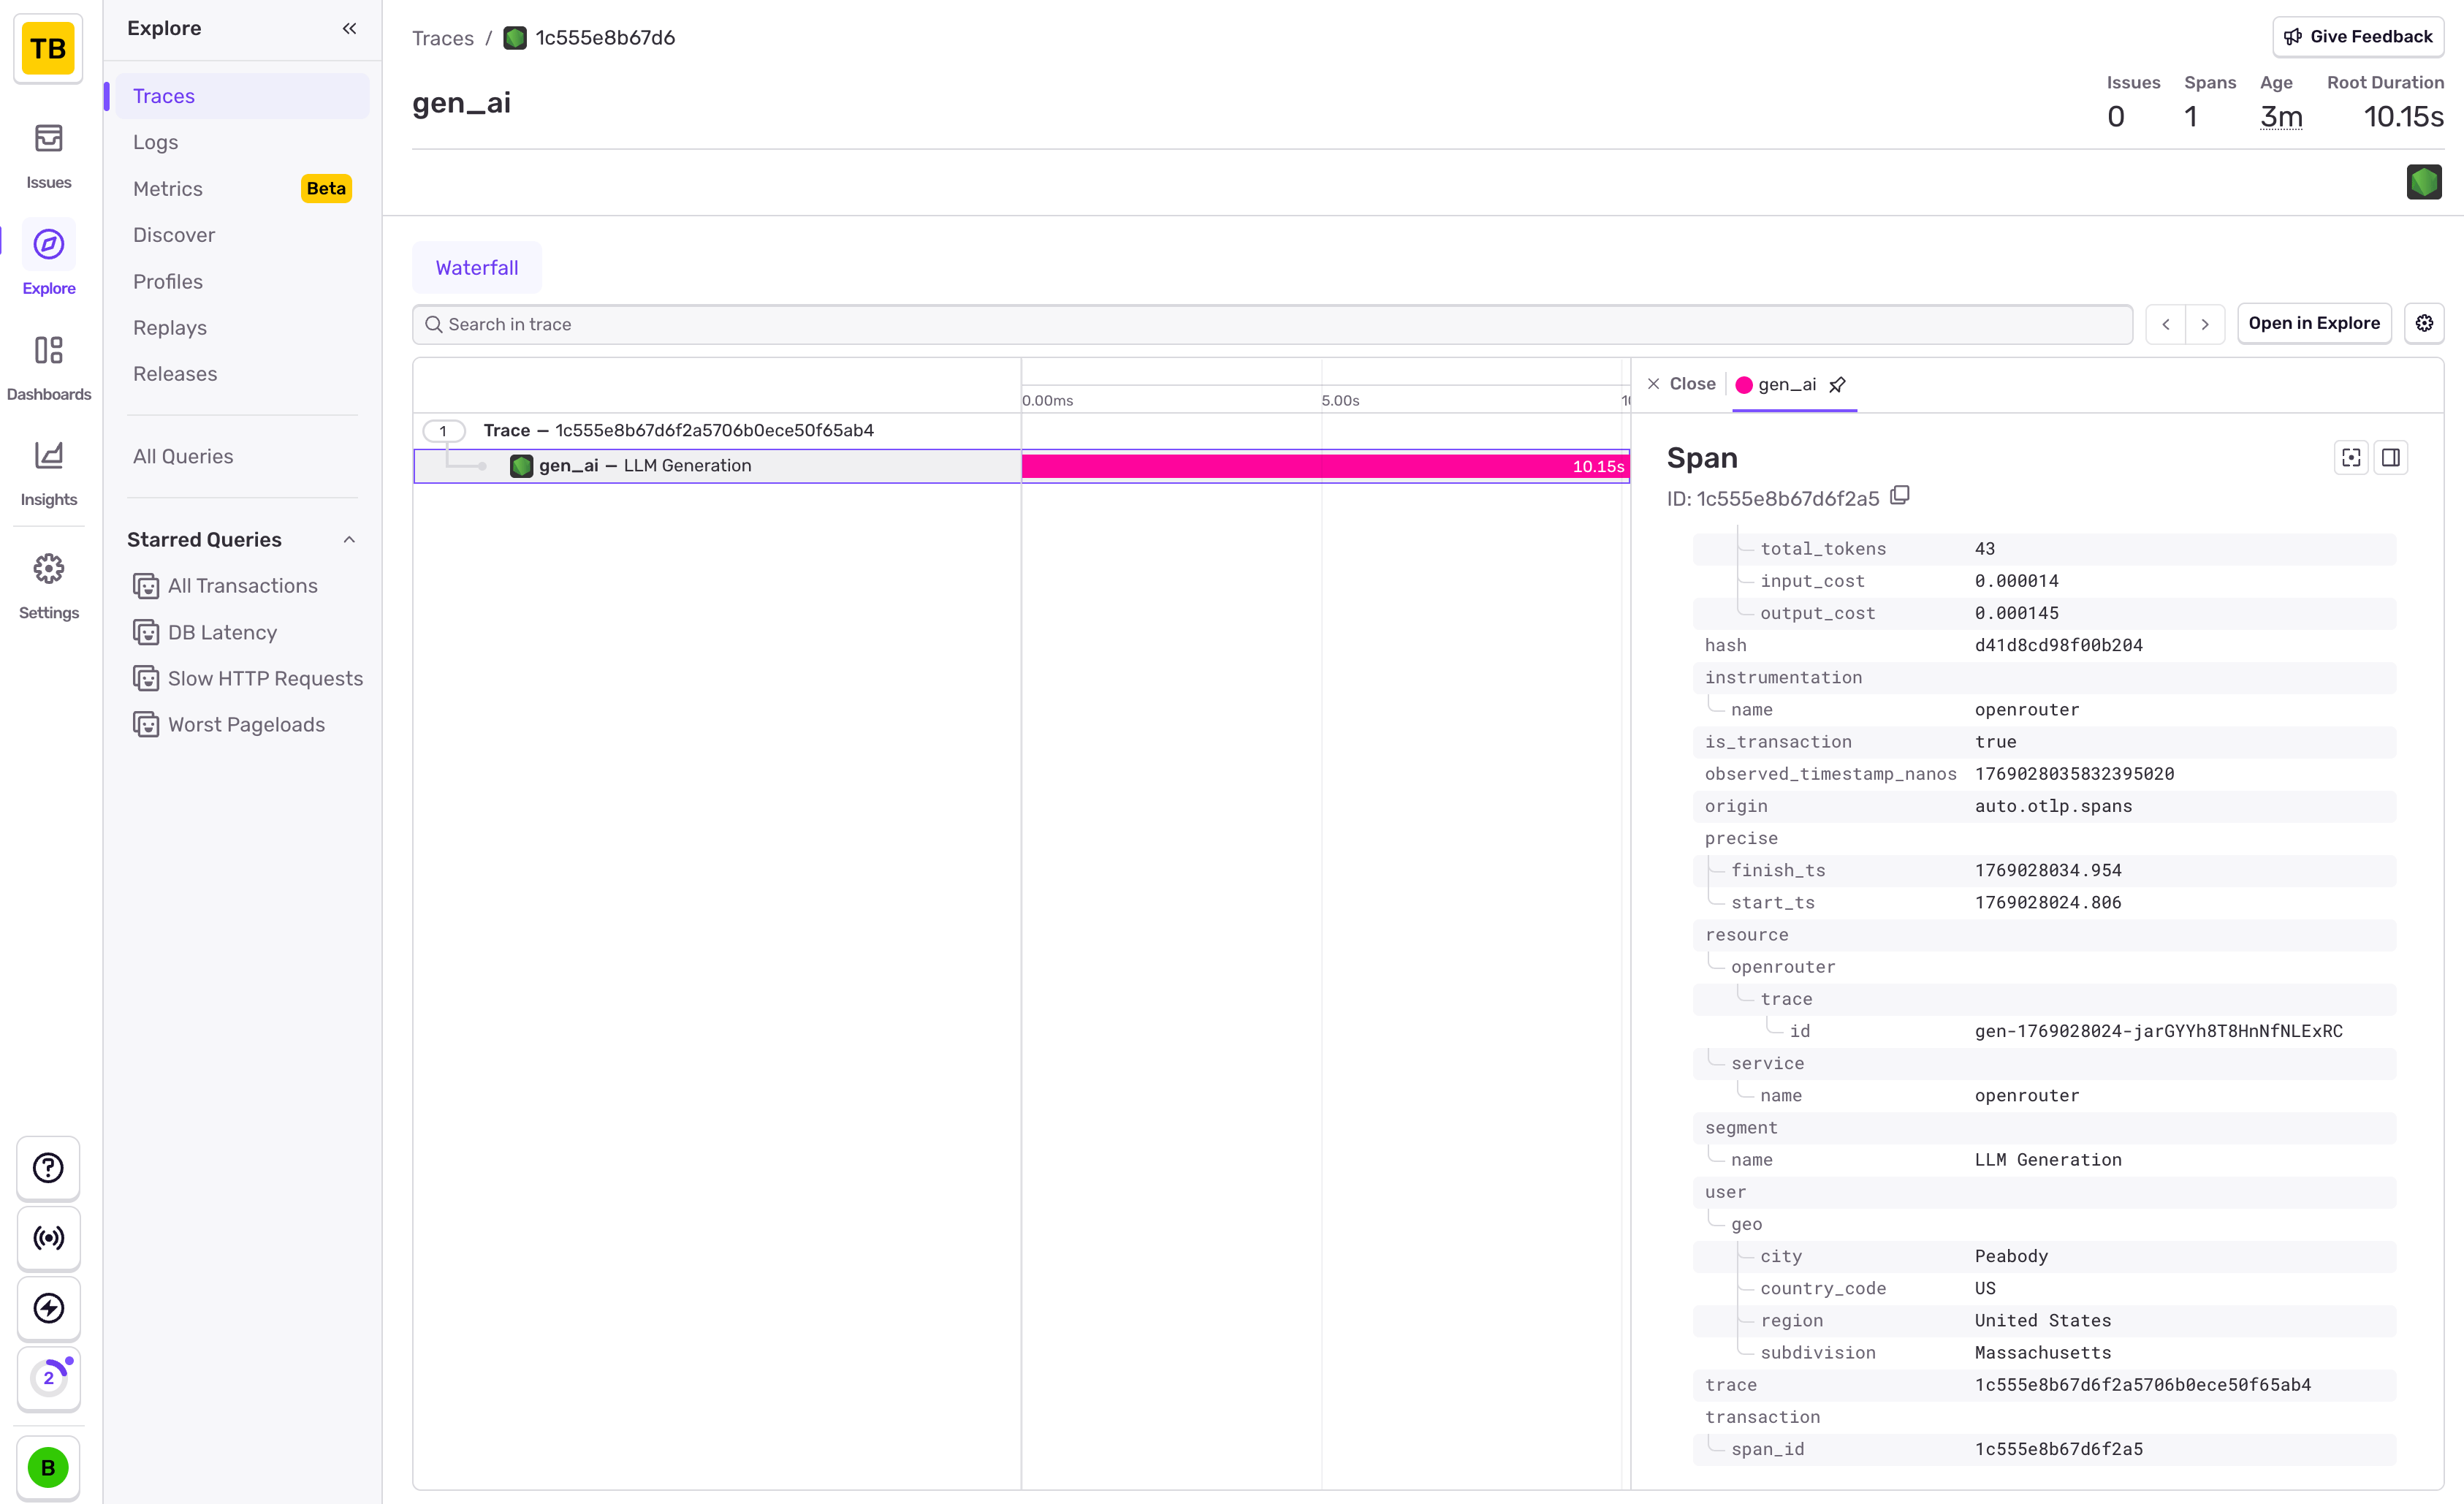
Make an API request through OpenRouter and view the trace in Sentry's
Performance or Traces view.
## Step 3: Configure Sentry
Click the edit icon next to **Sentry** and enter:
* **OTLP Traces Endpoint**: The OTLP endpoint URL from Sentry (e.g., `https://o123.ingest.us.sentry.io/api/456/integration/otlp/v1/traces`)
* **Sentry DSN**: Your Sentry DSN (e.g., `https://abc123@o123.ingest.us.sentry.io/456`)
## Step 4: Test and save
Click **Test Connection** to verify the setup. The configuration only saves if the test passes.
## Step 5: Send a test trace
Make an API request through OpenRouter and view the trace in Sentry's
Performance or Traces view.
 Sentry uses OpenTelemetry for trace ingestion. The OTLP endpoint and DSN
are both required for proper authentication and trace routing.
## Custom Metadata
Sentry receives traces via the OTLP protocol. Custom metadata from the `trace` field is sent as span attributes and can be used for filtering and analysis in Sentry's Performance view.
### Supported Metadata Keys
| Key | Sentry Mapping | Description |
| ----------------- | ---------------- | ------------------------------------------------ |
| `trace_id` | Trace ID | Group multiple requests into a single trace |
| `trace_name` | Transaction Name | Custom name for the root span |
| `span_name` | Span Description | Name for intermediate spans in the hierarchy |
| `generation_name` | Span Description | Name for the LLM generation span |
| `parent_span_id` | Parent Span ID | Link to an existing span in your trace hierarchy |
### Example
```json lines theme={null}
{
"model": "openai/gpt-4o",
"messages": [{ "role": "user", "content": "Debug this error..." }],
"user": "user_12345",
"session_id": "session_abc",
"trace": {
"trace_id": "incident_investigation_001",
"trace_name": "Error Analysis Agent",
"generation_name": "Analyze Stack Trace",
"environment": "production",
"release": "v2.1.0"
}
}
```
### Additional Context
* Custom metadata keys from `trace` are included as span attributes under the `trace.metadata.*` namespace
* The `user` field maps to `user.id` in span attributes
* The `session_id` field maps to `session.id` in span attributes
* Sentry automatically correlates LLM traces with your application's existing error and performance data when using `parent_span_id`
## Privacy Mode
When [Privacy Mode](/docs/guides/features/broadcast#privacy-mode) is enabled for this destination, prompt and completion content is excluded from traces. All other trace data (token usage, costs, timing, model information, and custom metadata) is still sent normally. See [Privacy Mode](/docs/guides/features/broadcast#privacy-mode) for details.
Sentry uses OpenTelemetry for trace ingestion. The OTLP endpoint and DSN
are both required for proper authentication and trace routing.
## Custom Metadata
Sentry receives traces via the OTLP protocol. Custom metadata from the `trace` field is sent as span attributes and can be used for filtering and analysis in Sentry's Performance view.
### Supported Metadata Keys
| Key | Sentry Mapping | Description |
| ----------------- | ---------------- | ------------------------------------------------ |
| `trace_id` | Trace ID | Group multiple requests into a single trace |
| `trace_name` | Transaction Name | Custom name for the root span |
| `span_name` | Span Description | Name for intermediate spans in the hierarchy |
| `generation_name` | Span Description | Name for the LLM generation span |
| `parent_span_id` | Parent Span ID | Link to an existing span in your trace hierarchy |
### Example
```json lines theme={null}
{
"model": "openai/gpt-4o",
"messages": [{ "role": "user", "content": "Debug this error..." }],
"user": "user_12345",
"session_id": "session_abc",
"trace": {
"trace_id": "incident_investigation_001",
"trace_name": "Error Analysis Agent",
"generation_name": "Analyze Stack Trace",
"environment": "production",
"release": "v2.1.0"
}
}
```
### Additional Context
* Custom metadata keys from `trace` are included as span attributes under the `trace.metadata.*` namespace
* The `user` field maps to `user.id` in span attributes
* The `session_id` field maps to `session.id` in span attributes
* Sentry automatically correlates LLM traces with your application's existing error and performance data when using `parent_span_id`
## Privacy Mode
When [Privacy Mode](/docs/guides/features/broadcast#privacy-mode) is enabled for this destination, prompt and completion content is excluded from traces. All other trace data (token usage, costs, timing, model information, and custom metadata) is still sent normally. See [Privacy Mode](/docs/guides/features/broadcast#privacy-mode) for details.