> ## Documentation Index
> Fetch the complete documentation index at: https://openrouter.ai/docs/llms.txt
> Use this file to discover all available pages before exploring further.
# New Relic
> Send traces to New Relic
[New Relic](https://newrelic.com) is a full-stack observability platform for monitoring applications, infrastructure, and digital experiences.
## Step 1: Get your New Relic license key
In New Relic, navigate to your API keys:
1. Log in to your New Relic account
2. Go to **API Keys** in your account settings
3. Create a new Ingest - License key or copy an existing one
## Step 2: Enable Broadcast in OpenRouter
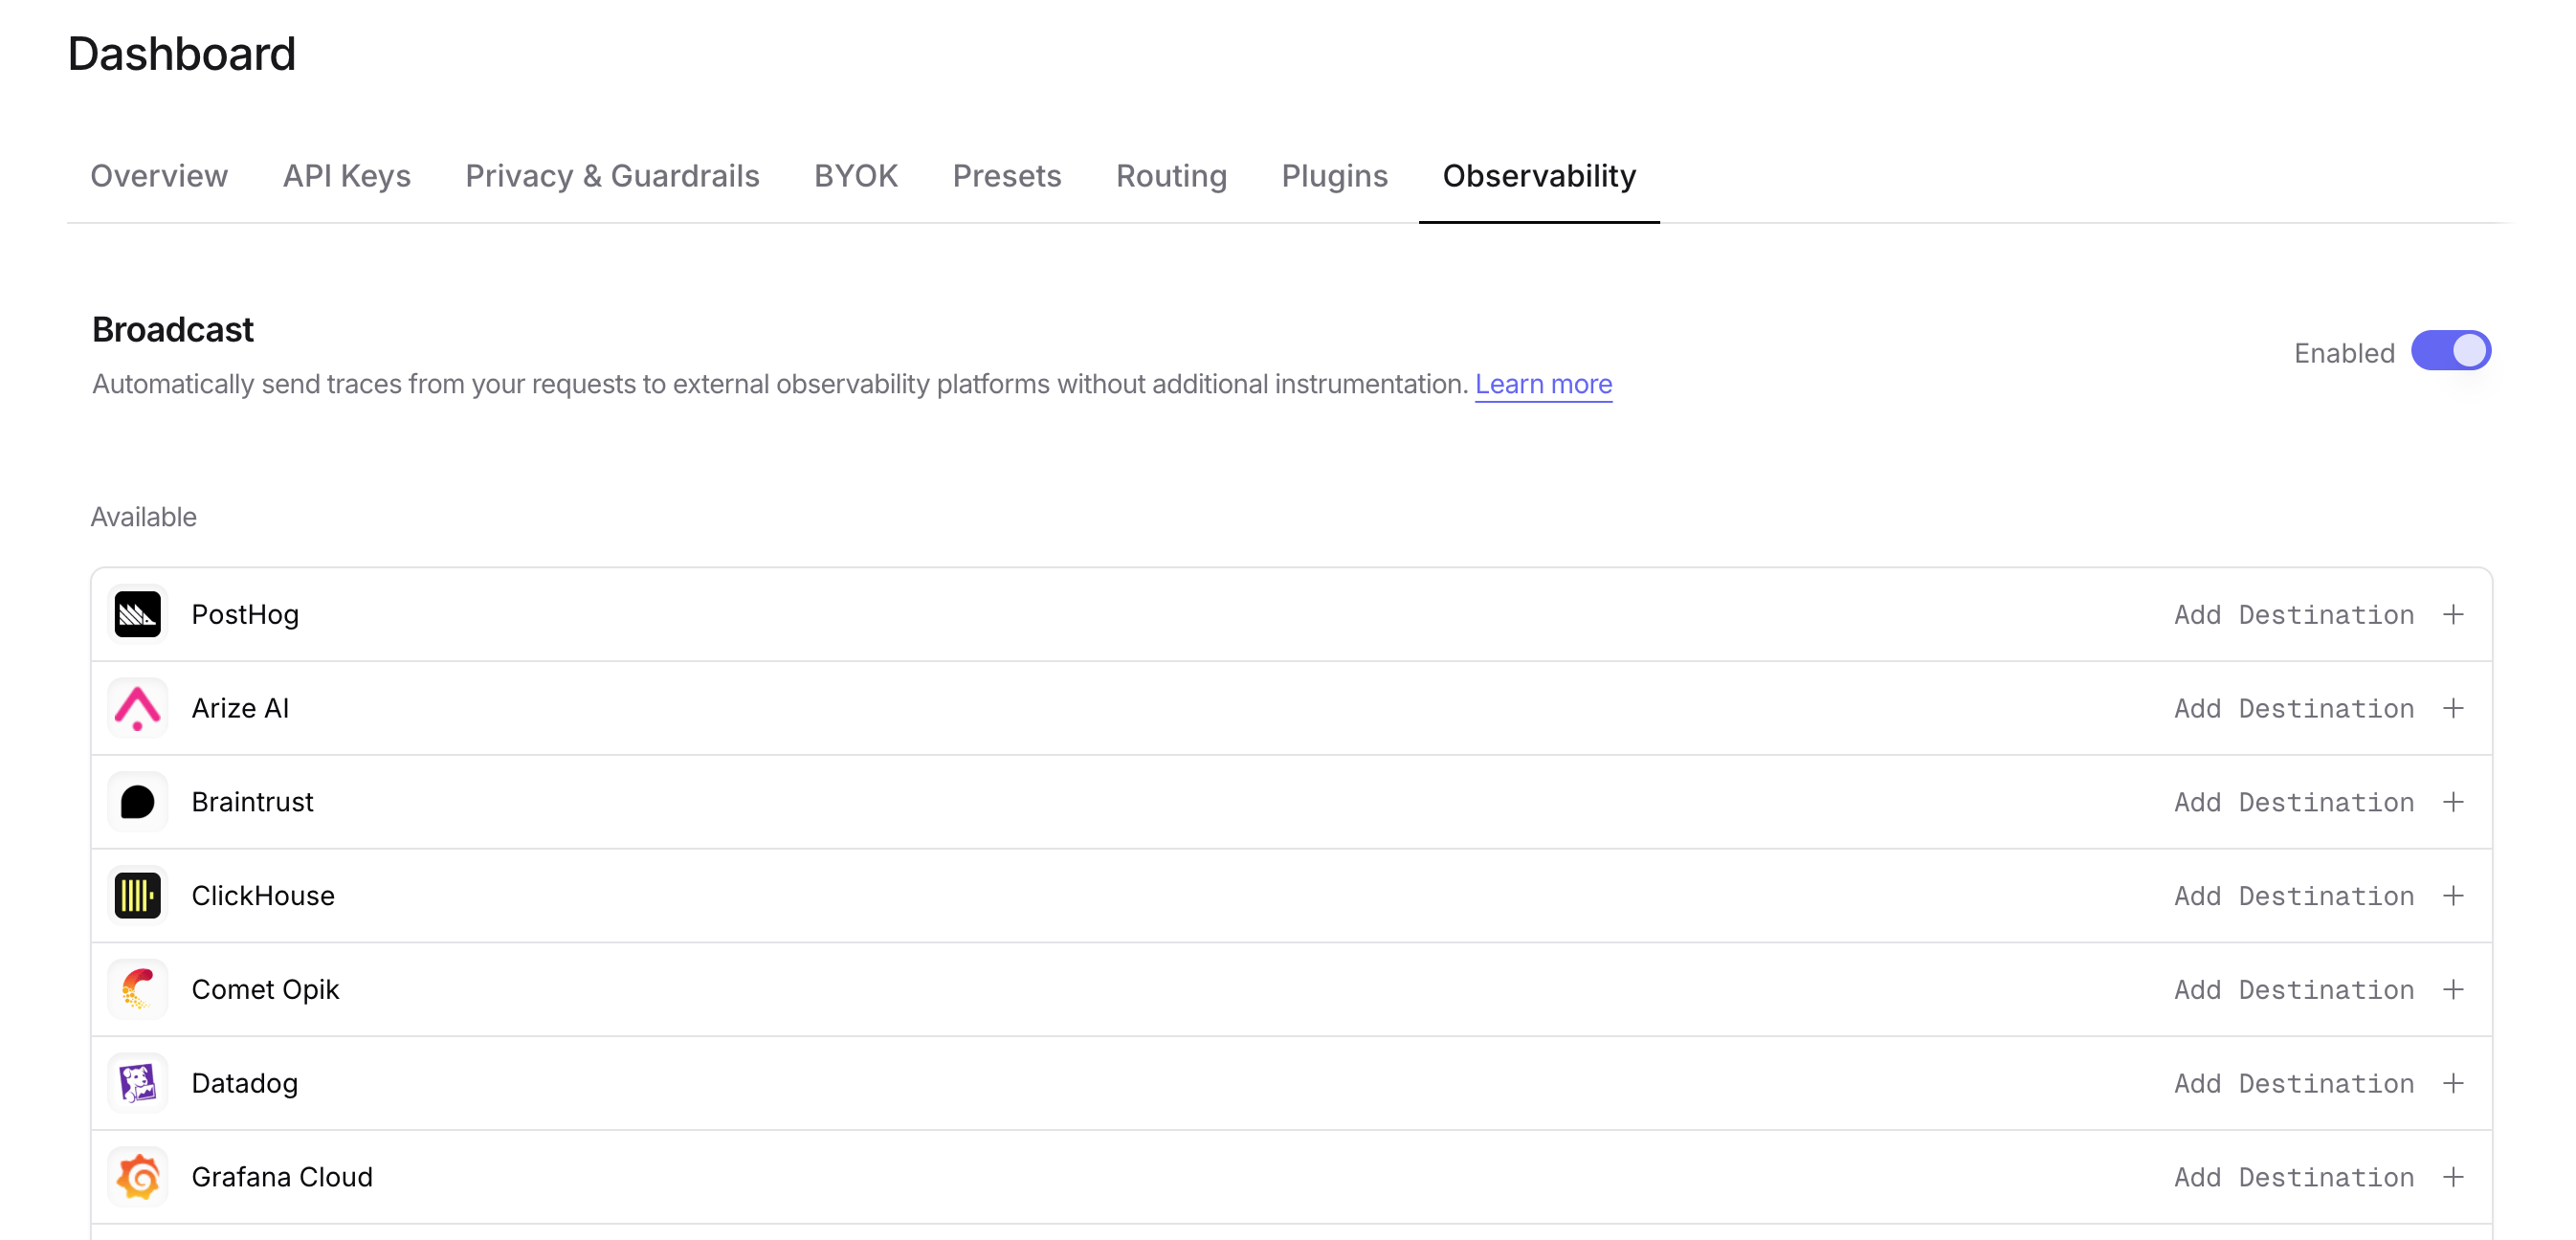
Go to [Settings > Observability](https://openrouter.ai/settings/observability) and toggle **Enable Broadcast**.
 ## Step 3: Configure New Relic
Click the edit icon next to **New Relic** and enter:
* **License Key**: Your New Relic ingest license key
* **Region**: Select your New Relic region (`us` or `eu`)
## Step 4: Test and save
Click **Test Connection** to verify the setup. The configuration only saves if the test passes.
## Step 5: Send a test trace
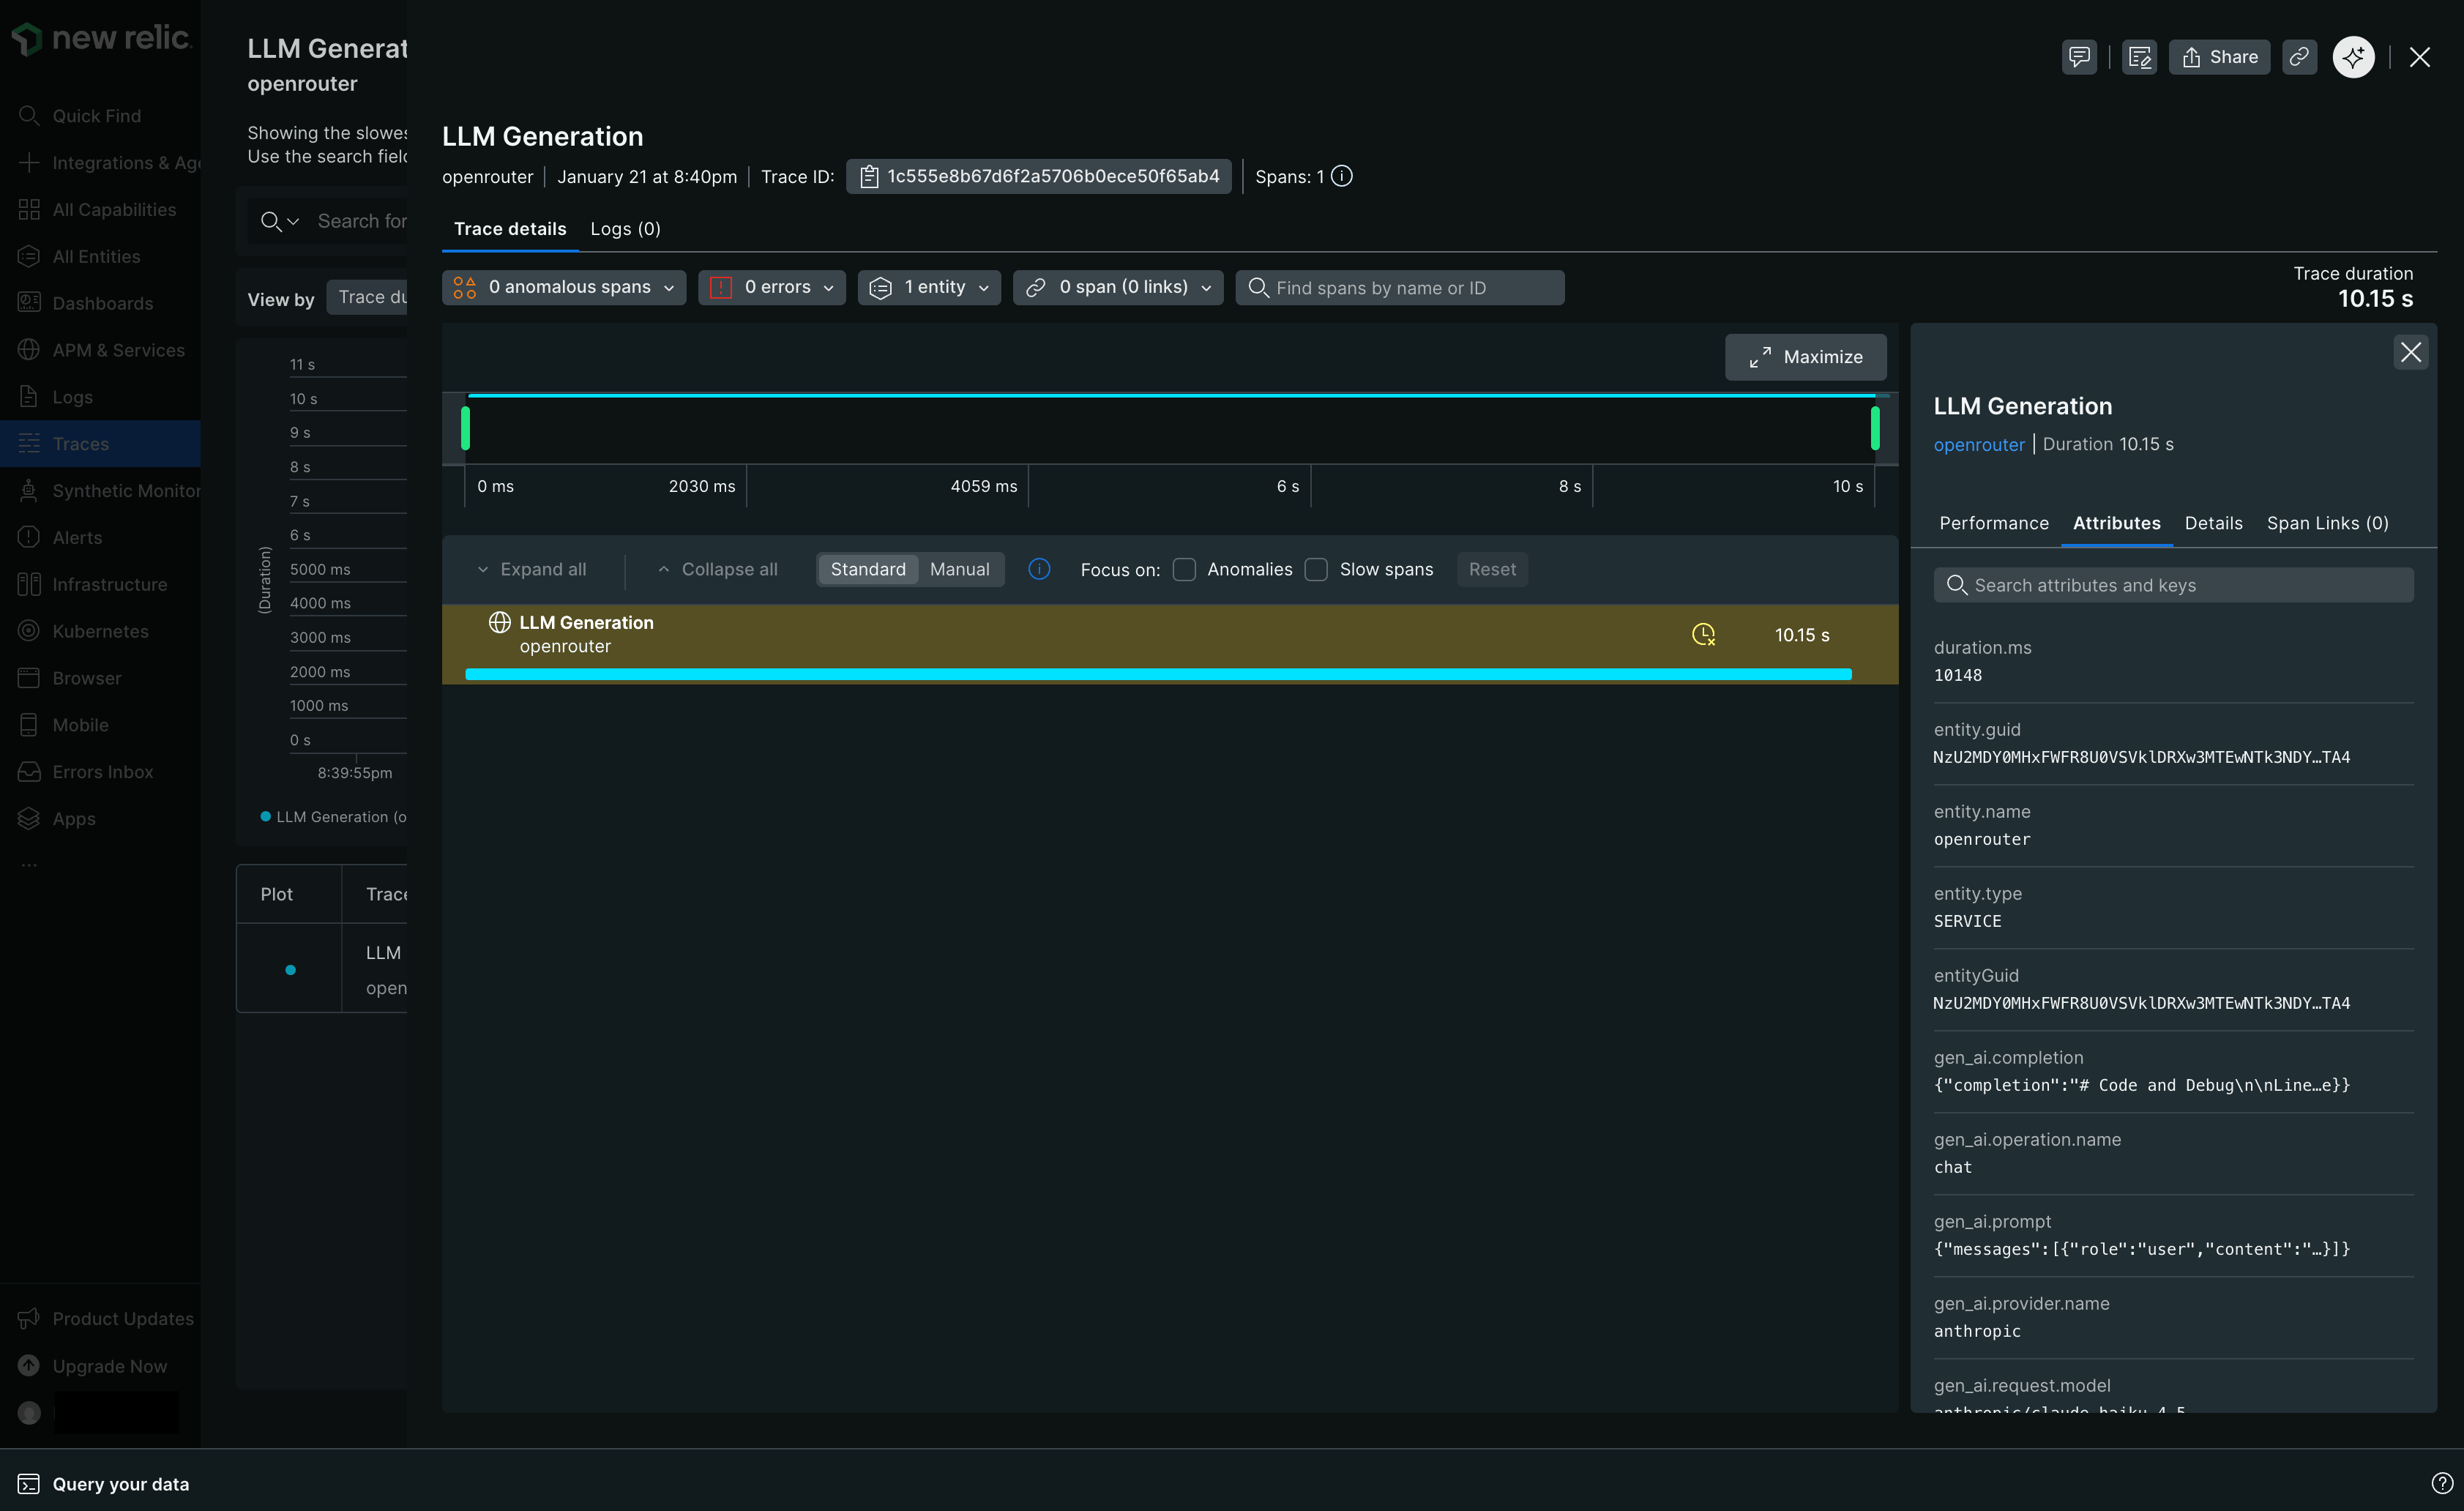
Make an API request through OpenRouter and view the trace in New Relic's
distributed tracing view.
## Step 3: Configure New Relic
Click the edit icon next to **New Relic** and enter:
* **License Key**: Your New Relic ingest license key
* **Region**: Select your New Relic region (`us` or `eu`)
## Step 4: Test and save
Click **Test Connection** to verify the setup. The configuration only saves if the test passes.
## Step 5: Send a test trace
Make an API request through OpenRouter and view the trace in New Relic's
distributed tracing view.
 ## Custom Metadata
New Relic receives traces via the OTLP protocol. Custom metadata from the `trace` field is sent as span attributes.
### Supported Metadata Keys
| Key | New Relic Mapping | Description |
| ----------------- | ----------------- | ------------------------------------------------ |
| `trace_id` | Trace ID | Group multiple requests into a single trace |
| `trace_name` | Span Name | Custom name for the root span |
| `span_name` | Span Name | Name for intermediate spans in the hierarchy |
| `generation_name` | Span Name | Name for the LLM generation span |
| `parent_span_id` | Parent Span ID | Link to an existing span in your trace hierarchy |
### Example
```json lines theme={null}
{
"model": "openai/gpt-4o",
"messages": [{ "role": "user", "content": "Summarize this report..." }],
"user": "user_12345",
"session_id": "session_abc",
"trace": {
"trace_id": "workflow_789",
"trace_name": "Report Processing",
"generation_name": "Summarize Report",
"environment": "production",
"service": "report-api"
}
}
```
### Viewing in New Relic
In New Relic's distributed tracing view, you can:
* Filter traces by custom attributes using NRQL queries
* View custom metadata in the span attributes panel
* Create alerts and dashboards based on metadata fields
### Additional Context
* Custom metadata keys from `trace` are included as span attributes under the `trace.metadata.*` namespace
* The `user` field maps to `user.id` in span attributes
* The `session_id` field maps to `session.id` in span attributes
* GenAI semantic conventions (`gen_ai.*` attributes) are used for model, token, and cost data
## Privacy Mode
When [Privacy Mode](/docs/guides/features/broadcast#privacy-mode) is enabled for this destination, prompt and completion content is excluded from traces. All other trace data — token usage, costs, timing, model information, and custom metadata — is still sent normally. See [Privacy Mode](/docs/guides/features/broadcast#privacy-mode) for details.
## Custom Metadata
New Relic receives traces via the OTLP protocol. Custom metadata from the `trace` field is sent as span attributes.
### Supported Metadata Keys
| Key | New Relic Mapping | Description |
| ----------------- | ----------------- | ------------------------------------------------ |
| `trace_id` | Trace ID | Group multiple requests into a single trace |
| `trace_name` | Span Name | Custom name for the root span |
| `span_name` | Span Name | Name for intermediate spans in the hierarchy |
| `generation_name` | Span Name | Name for the LLM generation span |
| `parent_span_id` | Parent Span ID | Link to an existing span in your trace hierarchy |
### Example
```json lines theme={null}
{
"model": "openai/gpt-4o",
"messages": [{ "role": "user", "content": "Summarize this report..." }],
"user": "user_12345",
"session_id": "session_abc",
"trace": {
"trace_id": "workflow_789",
"trace_name": "Report Processing",
"generation_name": "Summarize Report",
"environment": "production",
"service": "report-api"
}
}
```
### Viewing in New Relic
In New Relic's distributed tracing view, you can:
* Filter traces by custom attributes using NRQL queries
* View custom metadata in the span attributes panel
* Create alerts and dashboards based on metadata fields
### Additional Context
* Custom metadata keys from `trace` are included as span attributes under the `trace.metadata.*` namespace
* The `user` field maps to `user.id` in span attributes
* The `session_id` field maps to `session.id` in span attributes
* GenAI semantic conventions (`gen_ai.*` attributes) are used for model, token, and cost data
## Privacy Mode
When [Privacy Mode](/docs/guides/features/broadcast#privacy-mode) is enabled for this destination, prompt and completion content is excluded from traces. All other trace data — token usage, costs, timing, model information, and custom metadata — is still sent normally. See [Privacy Mode](/docs/guides/features/broadcast#privacy-mode) for details.