> ## Documentation Index
> Fetch the complete documentation index at: https://openrouter.ai/docs/llms.txt
> Use this file to discover all available pages before exploring further.
# Grafana Cloud
> Send traces to Grafana Cloud
[Grafana Cloud](https://grafana.com/products/cloud/) is a fully-managed observability platform that includes Grafana Tempo for distributed tracing. OpenRouter sends traces via the standard OTLP HTTP/JSON endpoint.
## Step 1: Get your Grafana Cloud credentials
You'll need three values from your Grafana Cloud portal:
1. **Base URL**: Your Grafana Cloud [OTLP endpoint](https://grafana.com/docs/grafana-cloud/send-data/otlp/send-data-otlp/) (e.g., `https://otlp-gateway-prod-us-west-0.grafana.net`)
2. **Instance ID**: Your numeric Grafana Cloud instance ID (e.g., `123456`)
3. **API Key**: A Grafana Cloud [API token with write permissions](https://grafana.com/docs/grafana-cloud/security-and-account-management/authentication-and-permissions/access-policies/create-access-policies/) (starts with `glc_...`)
### Finding your OTLP endpoint
1. Log in to your Grafana Cloud portal
2. Navigate to **Connections** > **Add new connection**
3. Search for **OpenTelemetry (OTLP)** and select it
4. On the configuration page, you'll find your **OTLP endpoint URL**
The base URL should be the OTLP gateway endpoint, not your main Grafana dashboard URL. The format is `https://otlp-gateway-prod-{region}.grafana.net`.
### Finding your Instance ID
1. Go to your Grafana Cloud account at `https://grafana.com/orgs/{your-org}/stacks`
2. Select your stack
3. Your **Instance ID** is the numeric value shown in the URL or on the stack details page
### Creating [an API token](https://grafana.com/docs/grafana-cloud/security-and-account-management/authentication-and-permissions/access-policies/create-access-policies/)
1. In Grafana Cloud, go to **My Account** > **Access Policies**
2. Create a new access policy with `traces:write` scope
3. Generate a token from this policy
4. Copy the token (starts with `glc_...`)
## Step 2: Enable Broadcast in OpenRouter
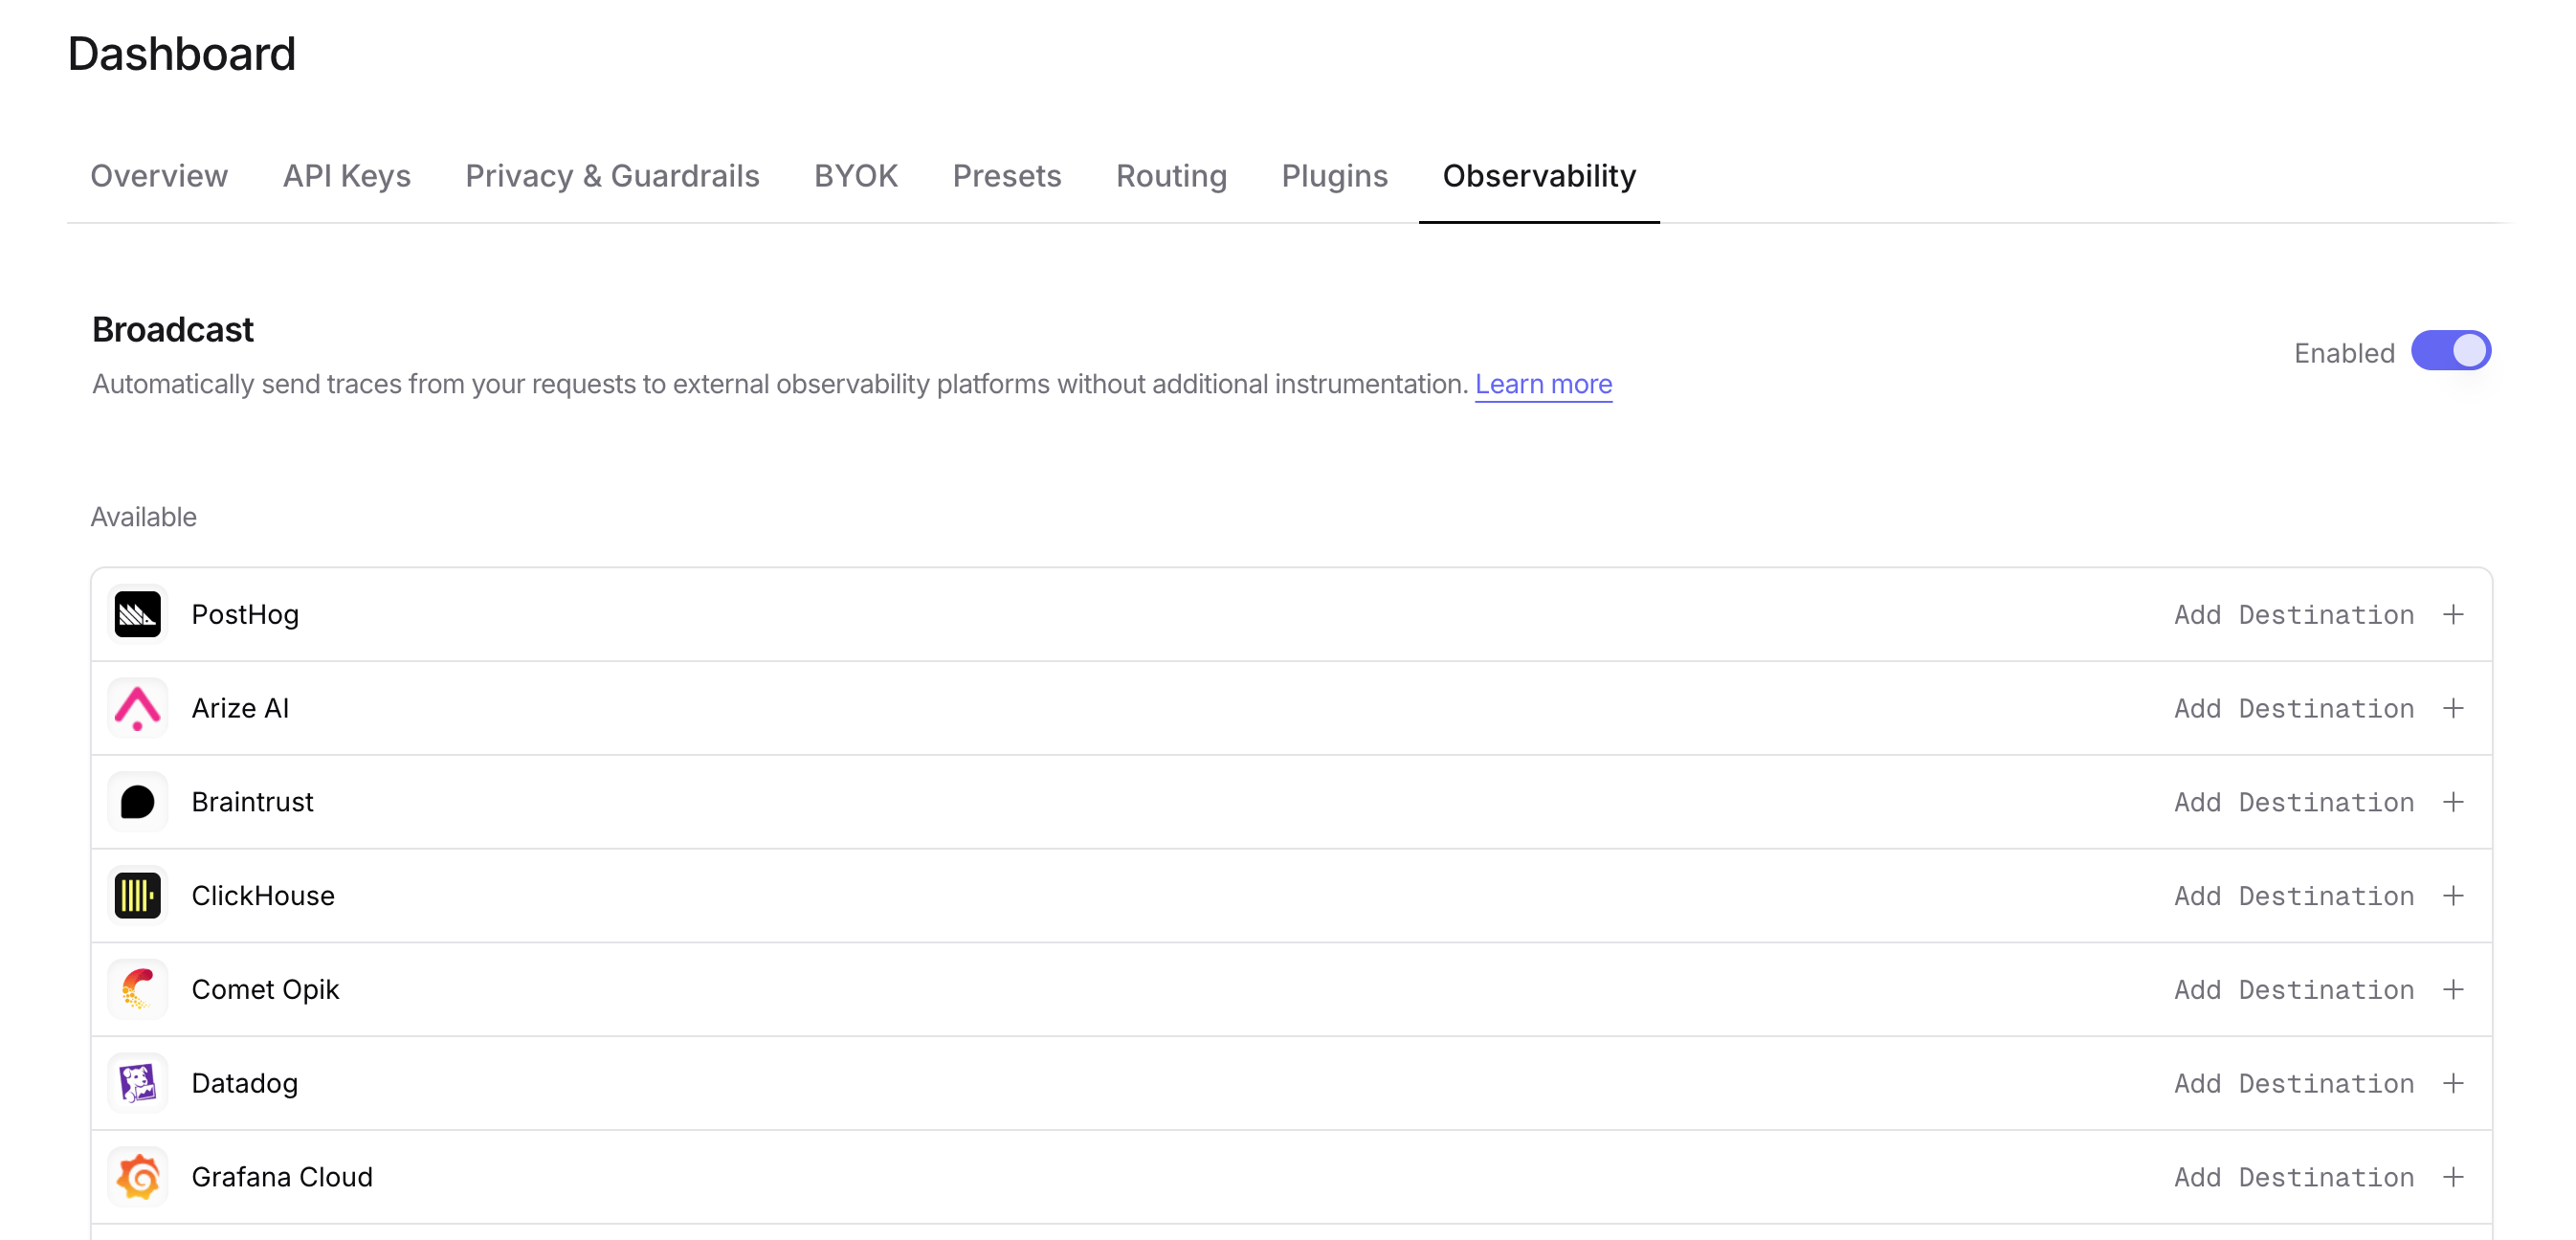
Go to [Settings > Observability](https://openrouter.ai/settings/observability) and toggle **Enable Broadcast**.
 ## Step 3: Configure Grafana Cloud
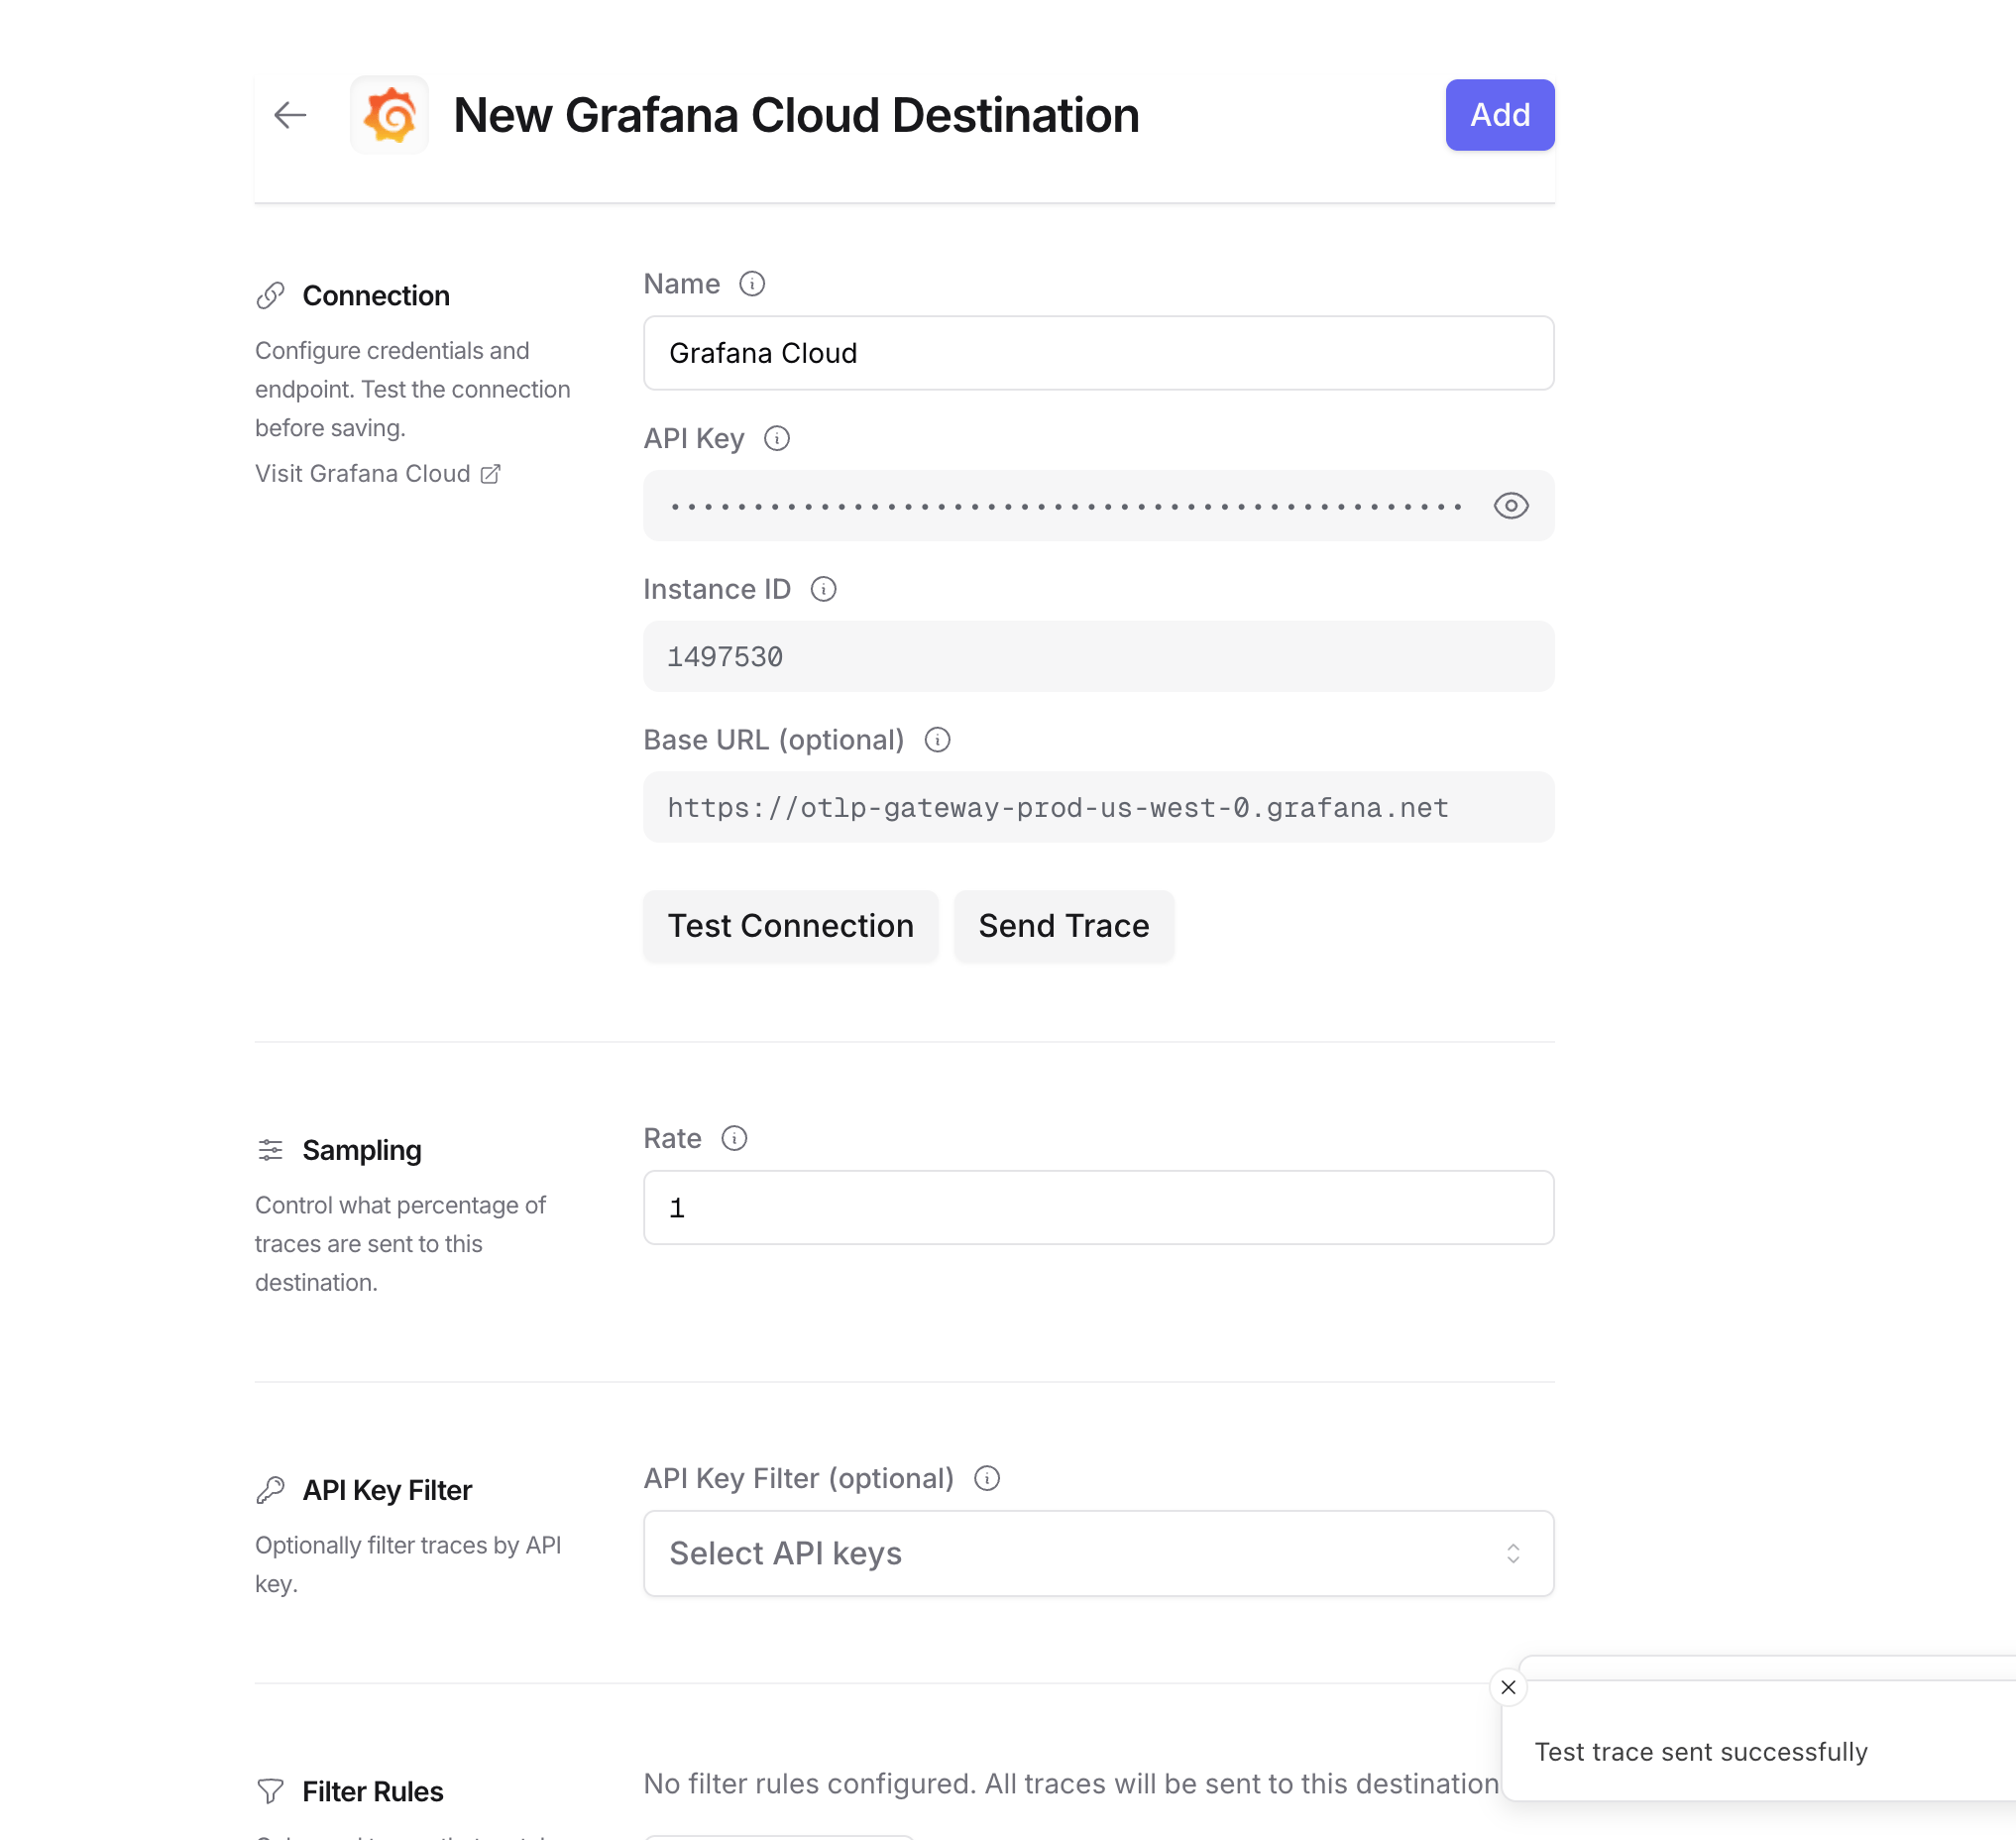
Click the edit icon next to **Grafana Cloud** and enter:
* **Base URL**: Your Grafana Cloud OTLP endpoint (e.g., `https://otlp-gateway-prod-us-west-0.grafana.net`)
* **Instance ID**: Your numeric Grafana Cloud instance ID
* **API Key**: Your Grafana Cloud API token with write permissions
## Step 3: Configure Grafana Cloud
Click the edit icon next to **Grafana Cloud** and enter:
* **Base URL**: Your Grafana Cloud OTLP endpoint (e.g., `https://otlp-gateway-prod-us-west-0.grafana.net`)
* **Instance ID**: Your numeric Grafana Cloud instance ID
* **API Key**: Your Grafana Cloud API token with write permissions
 ## Step 4: Test and save
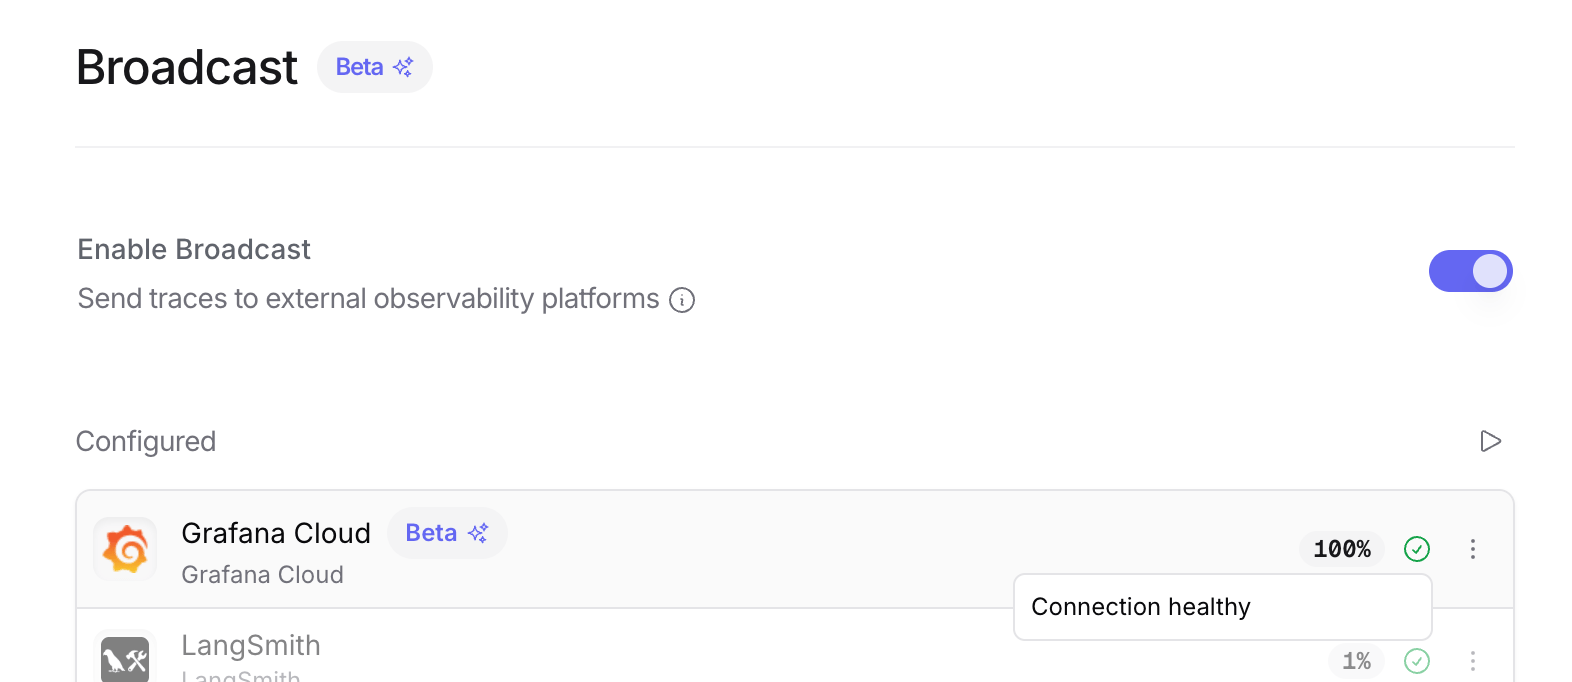
Click **Test Connection** to verify the setup. The configuration only saves if the test passes.
## Step 4: Test and save
Click **Test Connection** to verify the setup. The configuration only saves if the test passes.
 ## Step 5: Send a test trace
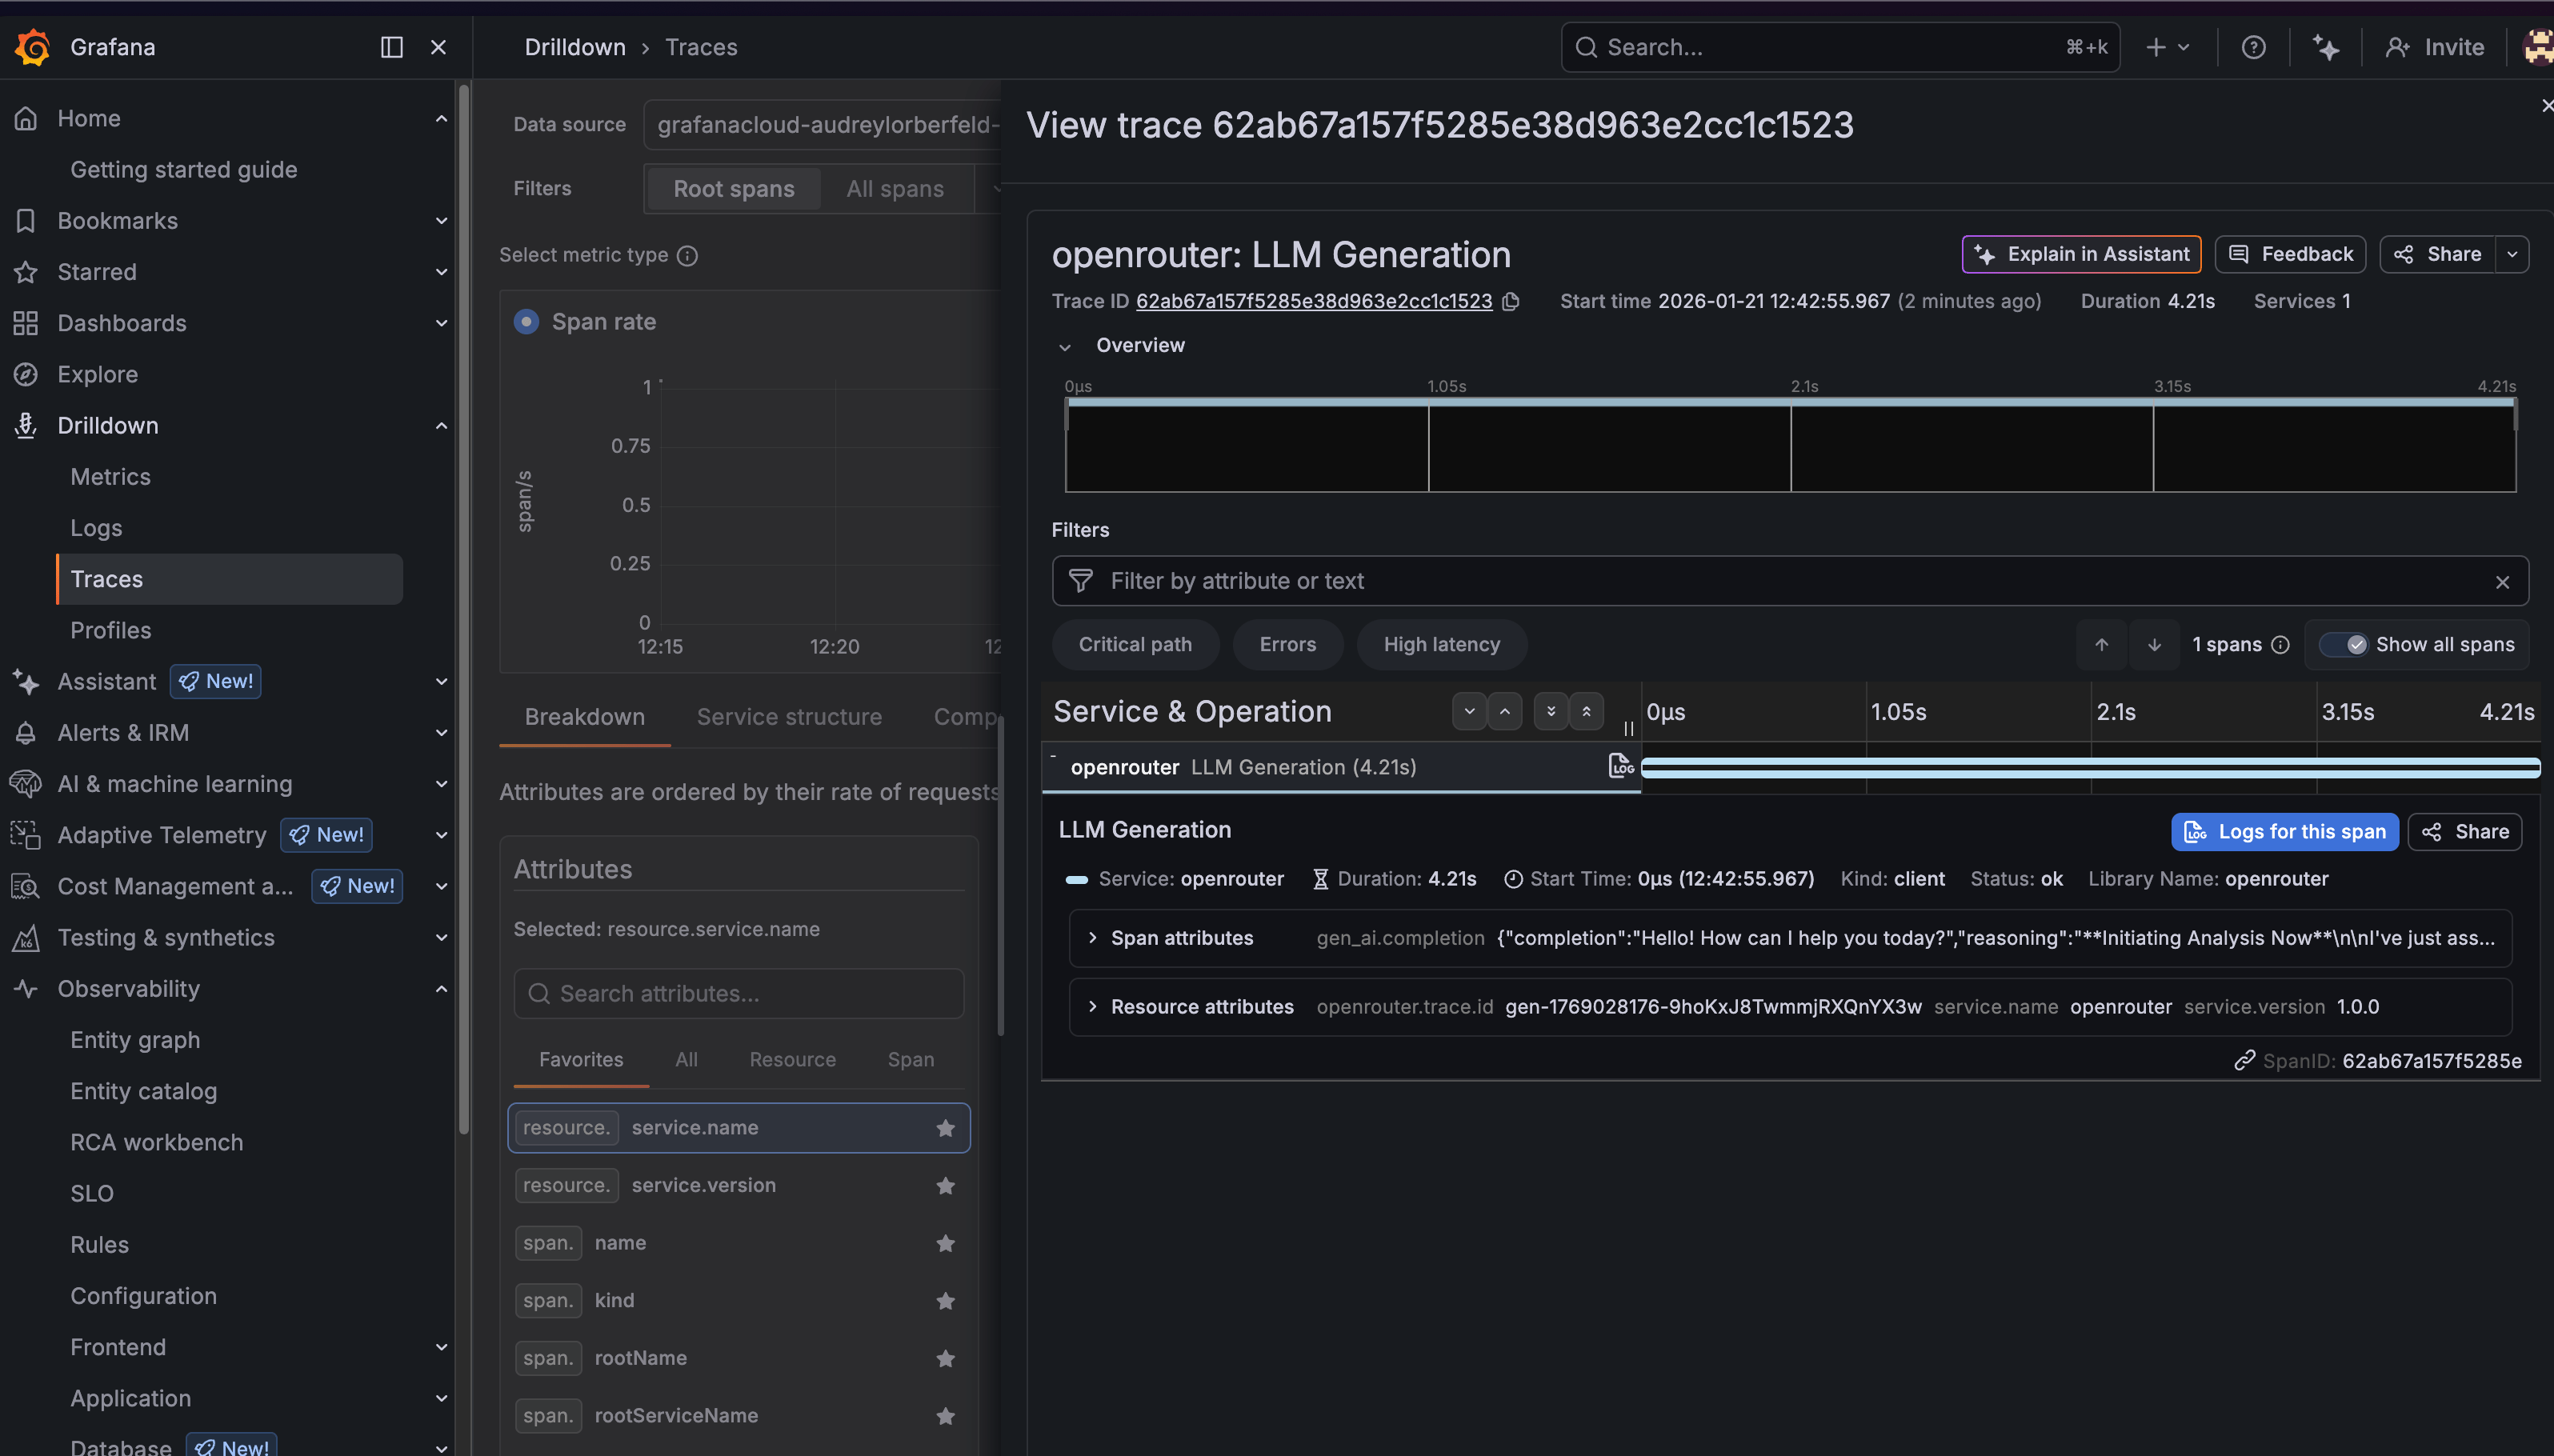
Make an API request through OpenRouter and view the trace in Grafana Cloud.
## Step 5: Send a test trace
Make an API request through OpenRouter and view the trace in Grafana Cloud.
 ## Viewing your traces
Once configured, you can view traces in Grafana Cloud in two ways:
### Option 1: Explore with TraceQL
1. Go to your Grafana Cloud instance (e.g., `https://your-stack.grafana.net`)
2. Click **Explore** in the left sidebar
3. Select your Tempo data source (e.g., `grafanacloud-*-traces`)
4. Switch to the **TraceQL** tab
5. Run this query to see all OpenRouter traces:
```traceql lines theme={null}
{ resource.service.name = "openrouter" }
```
You can also filter by specific attributes:
```traceql lines theme={null}
{ resource.service.name = "openrouter" && span.gen_ai.request.model = "openai/gpt-4-turbo" }
```
### Option 2: Drilldown > Traces
1. Go to your Grafana Cloud instance
2. Navigate to **Drilldown** > **Traces** in the left sidebar
3. Use the filters to find traces by service name, duration, or other attributes
4. Click on any trace to see the full span breakdown
## Trace attributes
OpenRouter traces include the following key attributes:
### Resource attributes
* `service.name`: Always `openrouter`
* `service.version`: `1.0.0`
* `openrouter.trace.id`: The OpenRouter trace ID
### Span attributes
* `gen_ai.operation.name`: The operation type (e.g., `chat`)
* `gen_ai.system`: The AI provider (e.g., `openai`)
* `gen_ai.request.model`: The requested model
* `gen_ai.response.model`: The actual model used
* `gen_ai.usage.input_tokens`: Number of input tokens
* `gen_ai.usage.output_tokens`: Number of output tokens
* `gen_ai.usage.total_tokens`: Total tokens used
* `gen_ai.response.finish_reason`: Why the generation ended (e.g., `stop`)
### Custom metadata
Any metadata you attach to your OpenRouter requests will appear under the `trace.metadata.*` namespace. See [Custom Metadata](#custom-metadata) below for details.
## Custom Metadata
Grafana Cloud receives traces via the OTLP protocol. Custom metadata from the `trace` field is sent as span attributes and can be queried using TraceQL.
### Supported Metadata Keys
| Key | Grafana Mapping | Description |
| ----------------- | --------------- | ------------------------------------------------ |
| `trace_id` | Trace ID | Group multiple requests into a single trace |
| `trace_name` | Span Name | Custom name for the root span |
| `span_name` | Span Name | Name for intermediate spans in the hierarchy |
| `generation_name` | Span Name | Name for the LLM generation span |
| `parent_span_id` | Parent Span ID | Link to an existing span in your trace hierarchy |
### Example
```json lines theme={null}
{
"model": "openai/gpt-4o",
"messages": [{ "role": "user", "content": "Analyze this metric..." }],
"user": "user_12345",
"session_id": "session_abc",
"trace": {
"trace_id": "monitoring_pipeline_001",
"trace_name": "Metric Analysis Pipeline",
"generation_name": "Anomaly Detection",
"environment": "production",
"alert_id": "alert_789"
}
}
```
### Querying Custom Metadata with TraceQL
Custom metadata keys are available as span attributes under `trace.metadata.*`:
```traceql lines theme={null}
{ resource.service.name = "openrouter" && span.trace.metadata.environment = "production" }
```
```traceql lines theme={null}
{ resource.service.name = "openrouter" && span.trace.metadata.alert_id = "alert_789" }
```
### Additional Context
* The `user` field maps to `user.id` in span attributes
* The `session_id` field maps to `session.id` in span attributes
* Custom metadata keys from `trace` appear under the `trace.metadata.*` namespace in span attributes
* You can create Grafana dashboards and alerts based on custom metadata attributes
## Example TraceQL queries
### Find slow requests (> 5 seconds)
```traceql lines theme={null}
{ resource.service.name = "openrouter" && duration > 5s }
```
### Find requests by user
```traceql lines theme={null}
{ resource.service.name = "openrouter" && span.user.id = "user_abc123" }
```
### Find errors
```traceql lines theme={null}
{ resource.service.name = "openrouter" && status = error }
```
### Find requests by model
```traceql lines theme={null}
{ resource.service.name = "openrouter" && span.gen_ai.request.model =~ ".*gpt-4.*" }
```
## Troubleshooting
### Traces not appearing
1. **Check the time range**: Grafana's time picker might not include your trace timestamp. Try expanding to "Last 1 hour" or "Last 24 hours".
2. **Verify the endpoint**: Make sure you're using the OTLP gateway URL (`https://otlp-gateway-prod-{region}.grafana.net`), not your main Grafana URL.
3. **Check authentication**: Ensure your Instance ID is numeric and your API key has write permissions.
4. **Wait a moment**: There can be a 1-2 minute delay before traces appear in Grafana.
### Wrong data source
If you don't see any traces, make sure you've selected the correct Tempo data source in the Explore view. It's typically named `grafanacloud-{stack}-traces`.
## Additional resources
* [Grafana Cloud OTLP Documentation](https://grafana.com/docs/grafana-cloud/send-data/otlp/)
* [TraceQL Query Language](https://grafana.com/docs/tempo/latest/traceql/)
* [Grafana Tempo Documentation](https://grafana.com/docs/tempo/latest/)
## Privacy Mode
When [Privacy Mode](/docs/guides/features/broadcast#privacy-mode) is enabled for this destination, prompt and completion content is excluded from traces. All other trace data — token usage, costs, timing, model information, and custom metadata — is still sent normally. See [Privacy Mode](/docs/guides/features/broadcast#privacy-mode) for details.
## Viewing your traces
Once configured, you can view traces in Grafana Cloud in two ways:
### Option 1: Explore with TraceQL
1. Go to your Grafana Cloud instance (e.g., `https://your-stack.grafana.net`)
2. Click **Explore** in the left sidebar
3. Select your Tempo data source (e.g., `grafanacloud-*-traces`)
4. Switch to the **TraceQL** tab
5. Run this query to see all OpenRouter traces:
```traceql lines theme={null}
{ resource.service.name = "openrouter" }
```
You can also filter by specific attributes:
```traceql lines theme={null}
{ resource.service.name = "openrouter" && span.gen_ai.request.model = "openai/gpt-4-turbo" }
```
### Option 2: Drilldown > Traces
1. Go to your Grafana Cloud instance
2. Navigate to **Drilldown** > **Traces** in the left sidebar
3. Use the filters to find traces by service name, duration, or other attributes
4. Click on any trace to see the full span breakdown
## Trace attributes
OpenRouter traces include the following key attributes:
### Resource attributes
* `service.name`: Always `openrouter`
* `service.version`: `1.0.0`
* `openrouter.trace.id`: The OpenRouter trace ID
### Span attributes
* `gen_ai.operation.name`: The operation type (e.g., `chat`)
* `gen_ai.system`: The AI provider (e.g., `openai`)
* `gen_ai.request.model`: The requested model
* `gen_ai.response.model`: The actual model used
* `gen_ai.usage.input_tokens`: Number of input tokens
* `gen_ai.usage.output_tokens`: Number of output tokens
* `gen_ai.usage.total_tokens`: Total tokens used
* `gen_ai.response.finish_reason`: Why the generation ended (e.g., `stop`)
### Custom metadata
Any metadata you attach to your OpenRouter requests will appear under the `trace.metadata.*` namespace. See [Custom Metadata](#custom-metadata) below for details.
## Custom Metadata
Grafana Cloud receives traces via the OTLP protocol. Custom metadata from the `trace` field is sent as span attributes and can be queried using TraceQL.
### Supported Metadata Keys
| Key | Grafana Mapping | Description |
| ----------------- | --------------- | ------------------------------------------------ |
| `trace_id` | Trace ID | Group multiple requests into a single trace |
| `trace_name` | Span Name | Custom name for the root span |
| `span_name` | Span Name | Name for intermediate spans in the hierarchy |
| `generation_name` | Span Name | Name for the LLM generation span |
| `parent_span_id` | Parent Span ID | Link to an existing span in your trace hierarchy |
### Example
```json lines theme={null}
{
"model": "openai/gpt-4o",
"messages": [{ "role": "user", "content": "Analyze this metric..." }],
"user": "user_12345",
"session_id": "session_abc",
"trace": {
"trace_id": "monitoring_pipeline_001",
"trace_name": "Metric Analysis Pipeline",
"generation_name": "Anomaly Detection",
"environment": "production",
"alert_id": "alert_789"
}
}
```
### Querying Custom Metadata with TraceQL
Custom metadata keys are available as span attributes under `trace.metadata.*`:
```traceql lines theme={null}
{ resource.service.name = "openrouter" && span.trace.metadata.environment = "production" }
```
```traceql lines theme={null}
{ resource.service.name = "openrouter" && span.trace.metadata.alert_id = "alert_789" }
```
### Additional Context
* The `user` field maps to `user.id` in span attributes
* The `session_id` field maps to `session.id` in span attributes
* Custom metadata keys from `trace` appear under the `trace.metadata.*` namespace in span attributes
* You can create Grafana dashboards and alerts based on custom metadata attributes
## Example TraceQL queries
### Find slow requests (> 5 seconds)
```traceql lines theme={null}
{ resource.service.name = "openrouter" && duration > 5s }
```
### Find requests by user
```traceql lines theme={null}
{ resource.service.name = "openrouter" && span.user.id = "user_abc123" }
```
### Find errors
```traceql lines theme={null}
{ resource.service.name = "openrouter" && status = error }
```
### Find requests by model
```traceql lines theme={null}
{ resource.service.name = "openrouter" && span.gen_ai.request.model =~ ".*gpt-4.*" }
```
## Troubleshooting
### Traces not appearing
1. **Check the time range**: Grafana's time picker might not include your trace timestamp. Try expanding to "Last 1 hour" or "Last 24 hours".
2. **Verify the endpoint**: Make sure you're using the OTLP gateway URL (`https://otlp-gateway-prod-{region}.grafana.net`), not your main Grafana URL.
3. **Check authentication**: Ensure your Instance ID is numeric and your API key has write permissions.
4. **Wait a moment**: There can be a 1-2 minute delay before traces appear in Grafana.
### Wrong data source
If you don't see any traces, make sure you've selected the correct Tempo data source in the Explore view. It's typically named `grafanacloud-{stack}-traces`.
## Additional resources
* [Grafana Cloud OTLP Documentation](https://grafana.com/docs/grafana-cloud/send-data/otlp/)
* [TraceQL Query Language](https://grafana.com/docs/tempo/latest/traceql/)
* [Grafana Tempo Documentation](https://grafana.com/docs/tempo/latest/)
## Privacy Mode
When [Privacy Mode](/docs/guides/features/broadcast#privacy-mode) is enabled for this destination, prompt and completion content is excluded from traces. All other trace data — token usage, costs, timing, model information, and custom metadata — is still sent normally. See [Privacy Mode](/docs/guides/features/broadcast#privacy-mode) for details.