> ## Documentation Index
> Fetch the complete documentation index at: https://openrouter.ai/docs/llms.txt
> Use this file to discover all available pages before exploring further.
# ClickHouse
> Send traces to ClickHouse
[ClickHouse](https://clickhouse.com) is a fast, open-source columnar database for real-time analytics. OpenRouter can stream traces directly to your ClickHouse database for high-performance analytics and custom dashboards.
## Step 1: Create the traces table
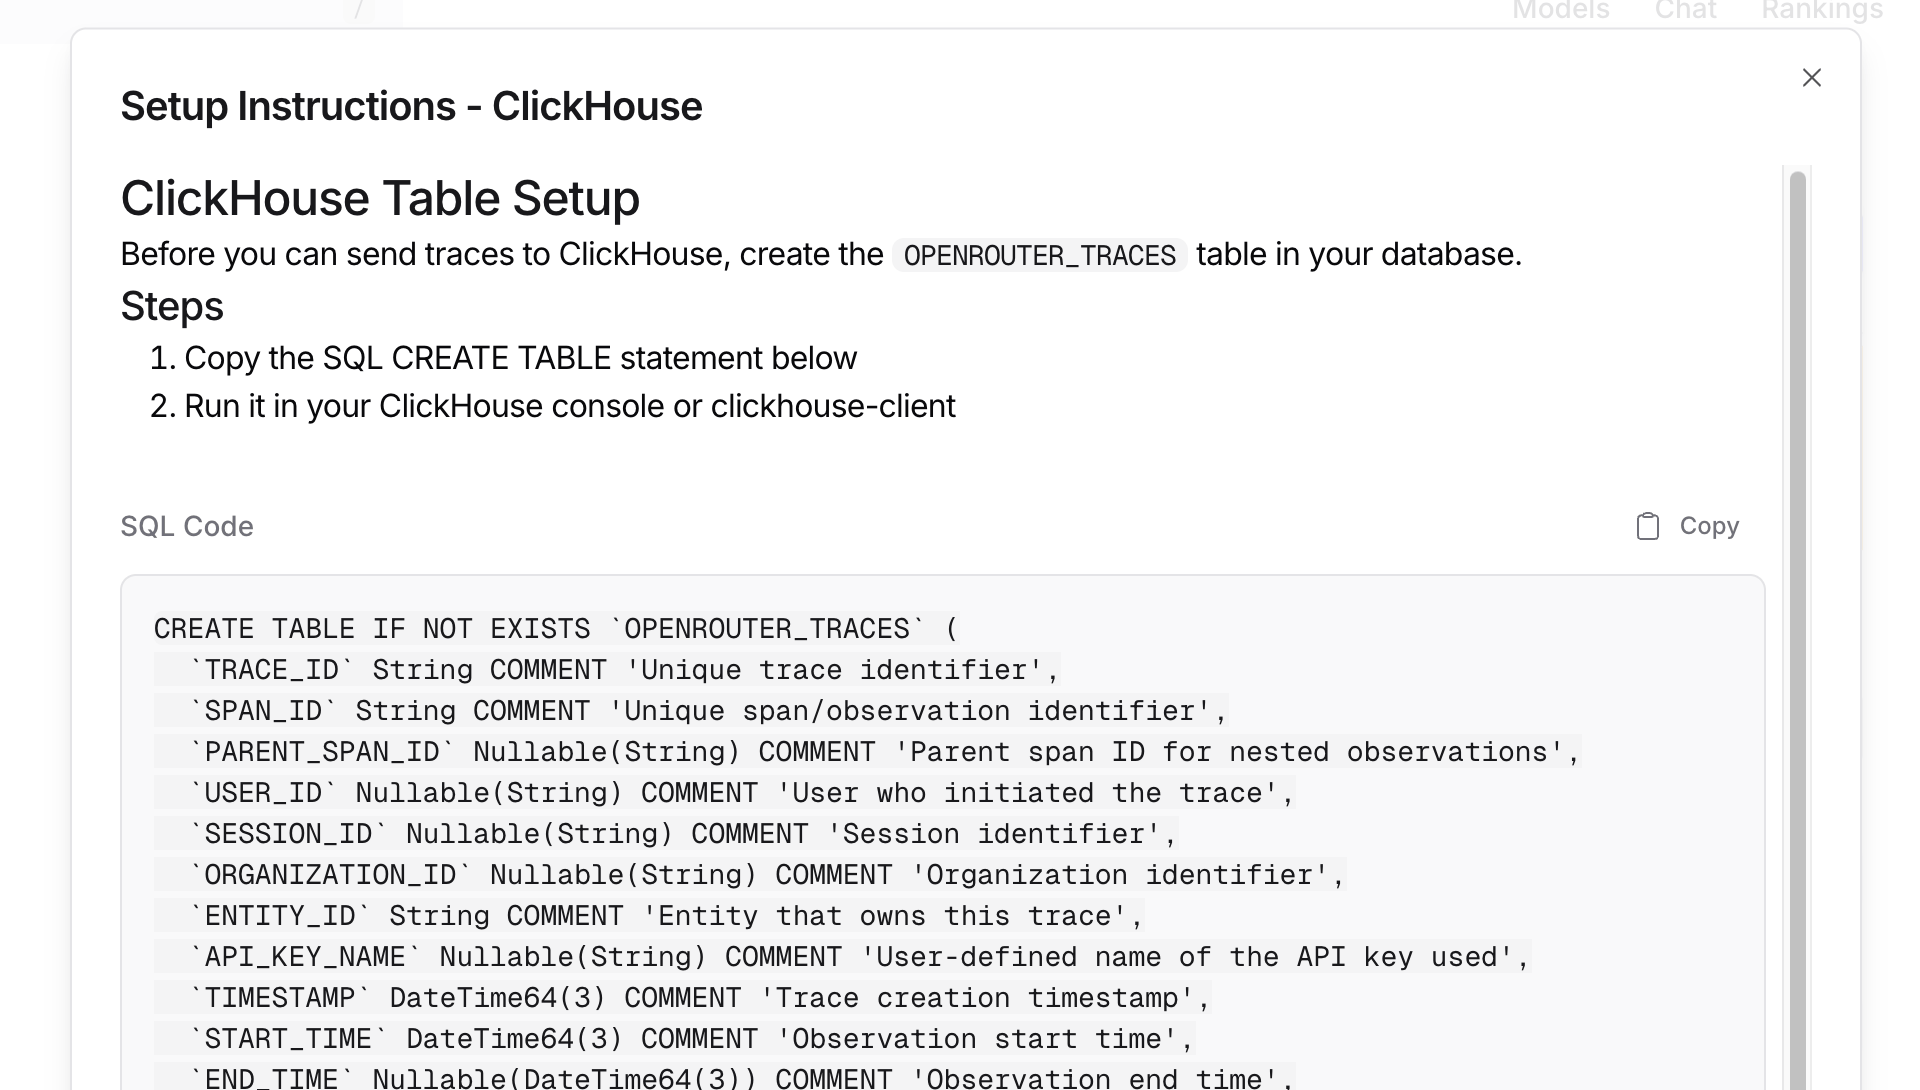
Before connecting OpenRouter, create the `OPENROUTER_TRACES` table in your ClickHouse database. You can find the exact SQL in the OpenRouter dashboard when configuring the destination:
 ## Step 2: Set up permissions
Ensure your ClickHouse user has CREATE TABLE permissions:
```sql lines theme={null}
GRANT CREATE TABLE ON your_database.* TO your_database_user;
```
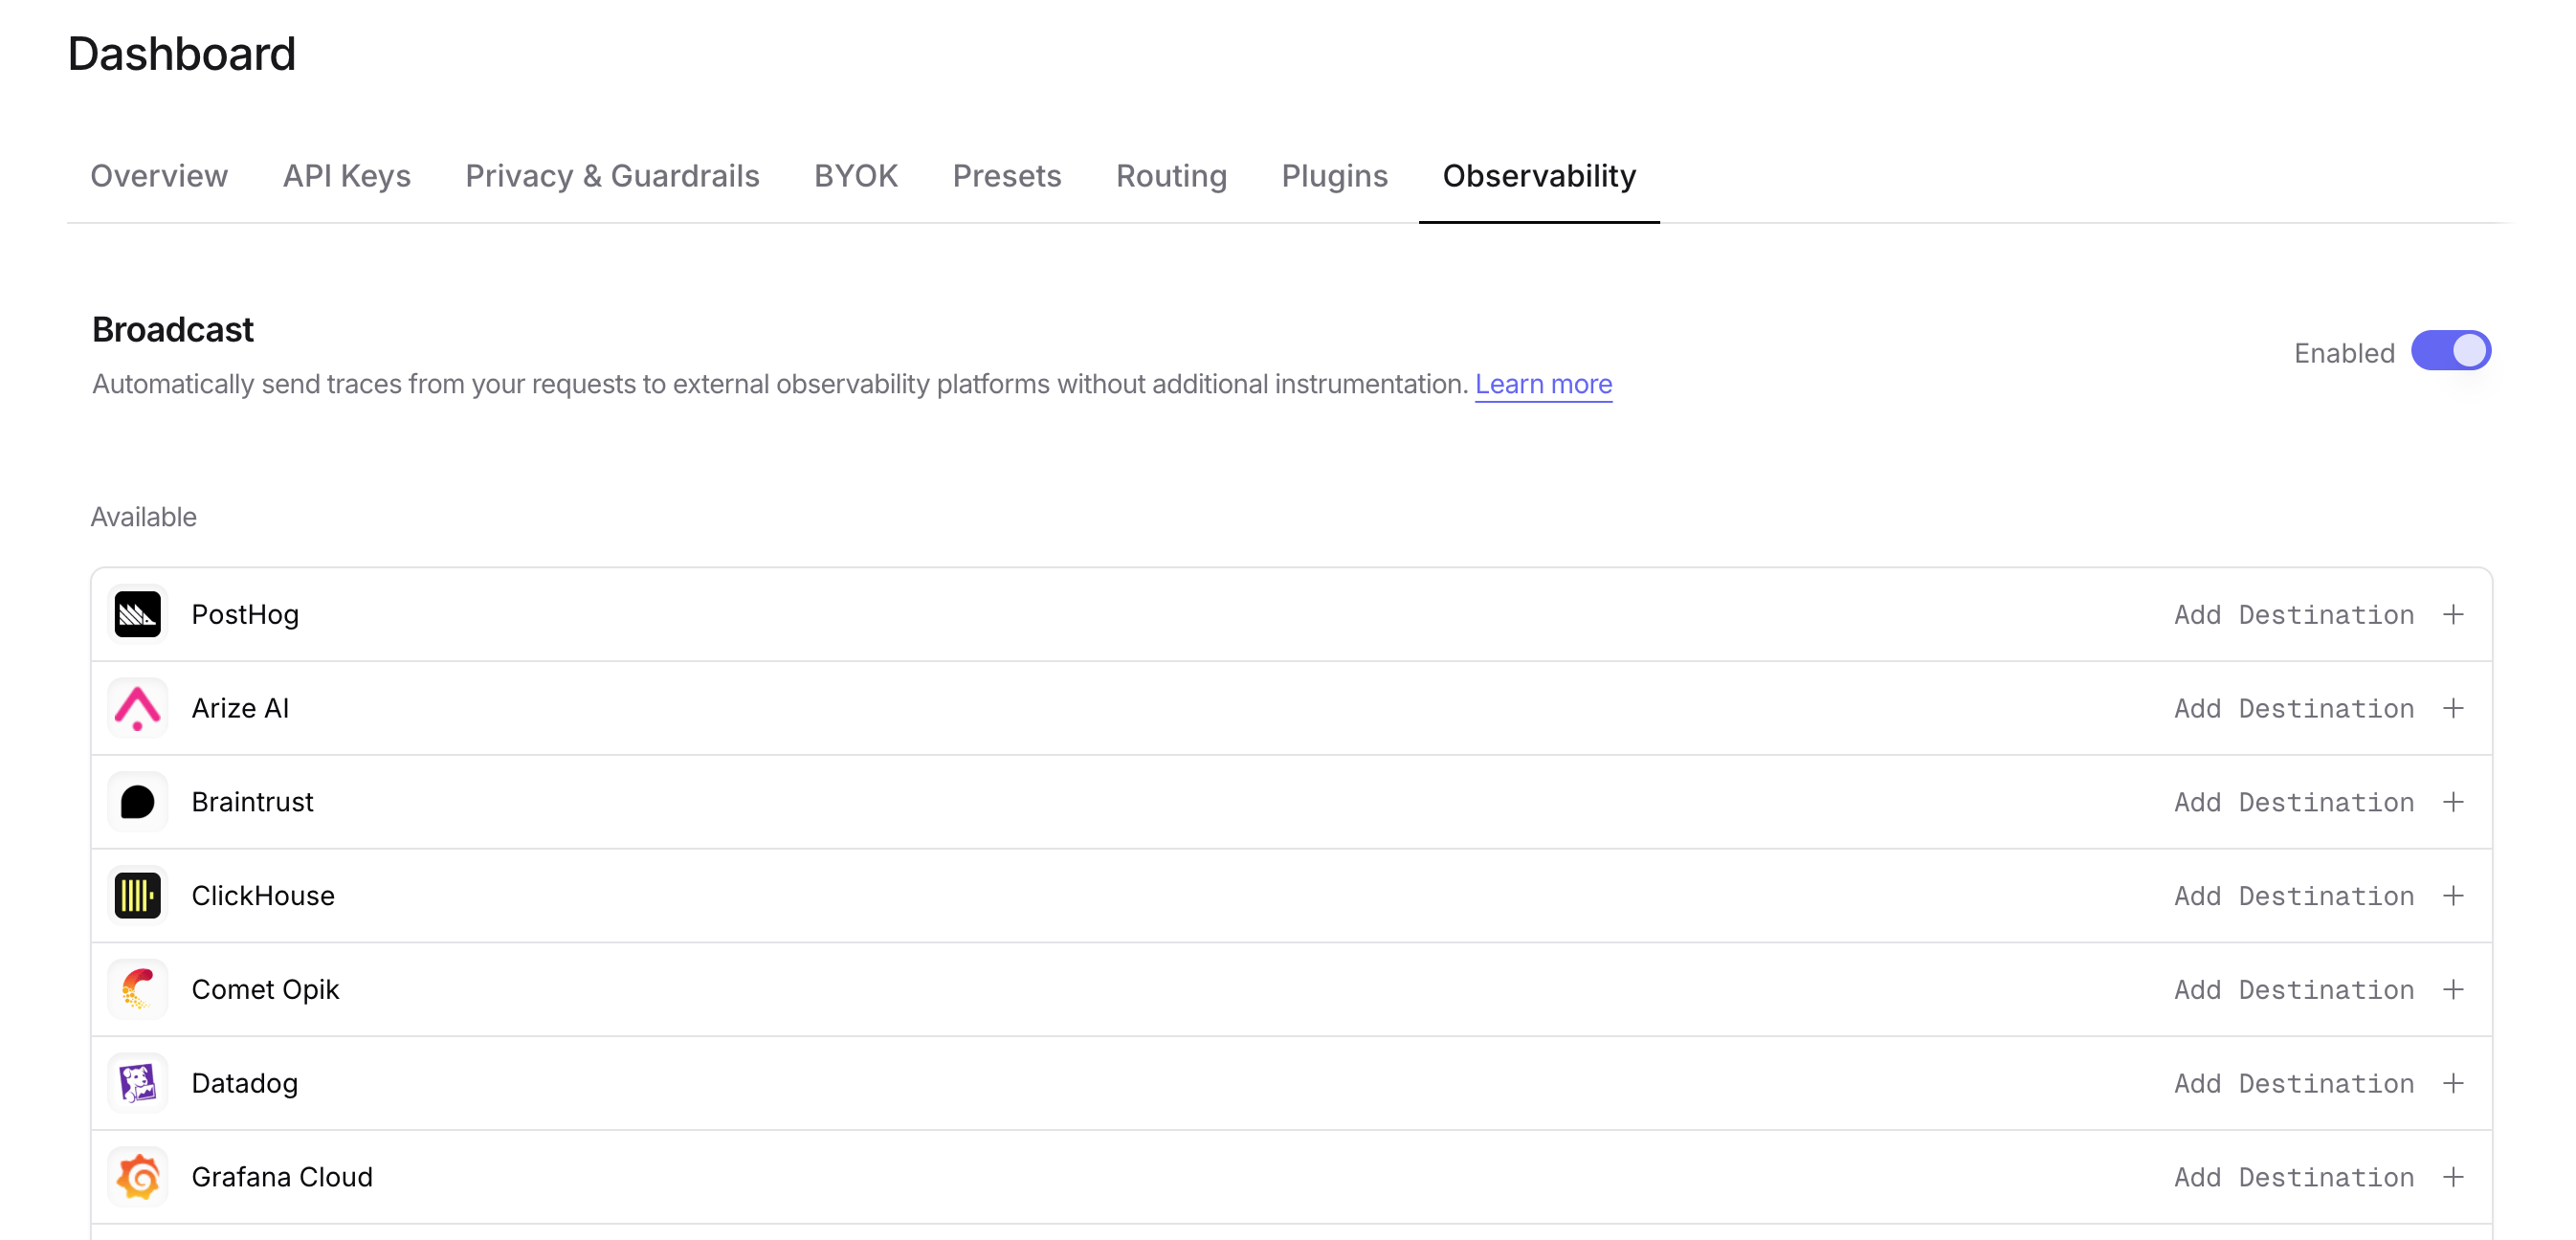
## Step 3: Enable Broadcast in OpenRouter
Go to [Settings > Observability](https://openrouter.ai/settings/observability) and toggle **Enable Broadcast**.
## Step 2: Set up permissions
Ensure your ClickHouse user has CREATE TABLE permissions:
```sql lines theme={null}
GRANT CREATE TABLE ON your_database.* TO your_database_user;
```
## Step 3: Enable Broadcast in OpenRouter
Go to [Settings > Observability](https://openrouter.ai/settings/observability) and toggle **Enable Broadcast**.
 ## Step 4: Configure ClickHouse
Click the edit icon next to **ClickHouse** and enter:
## Step 4: Configure ClickHouse
Click the edit icon next to **ClickHouse** and enter:
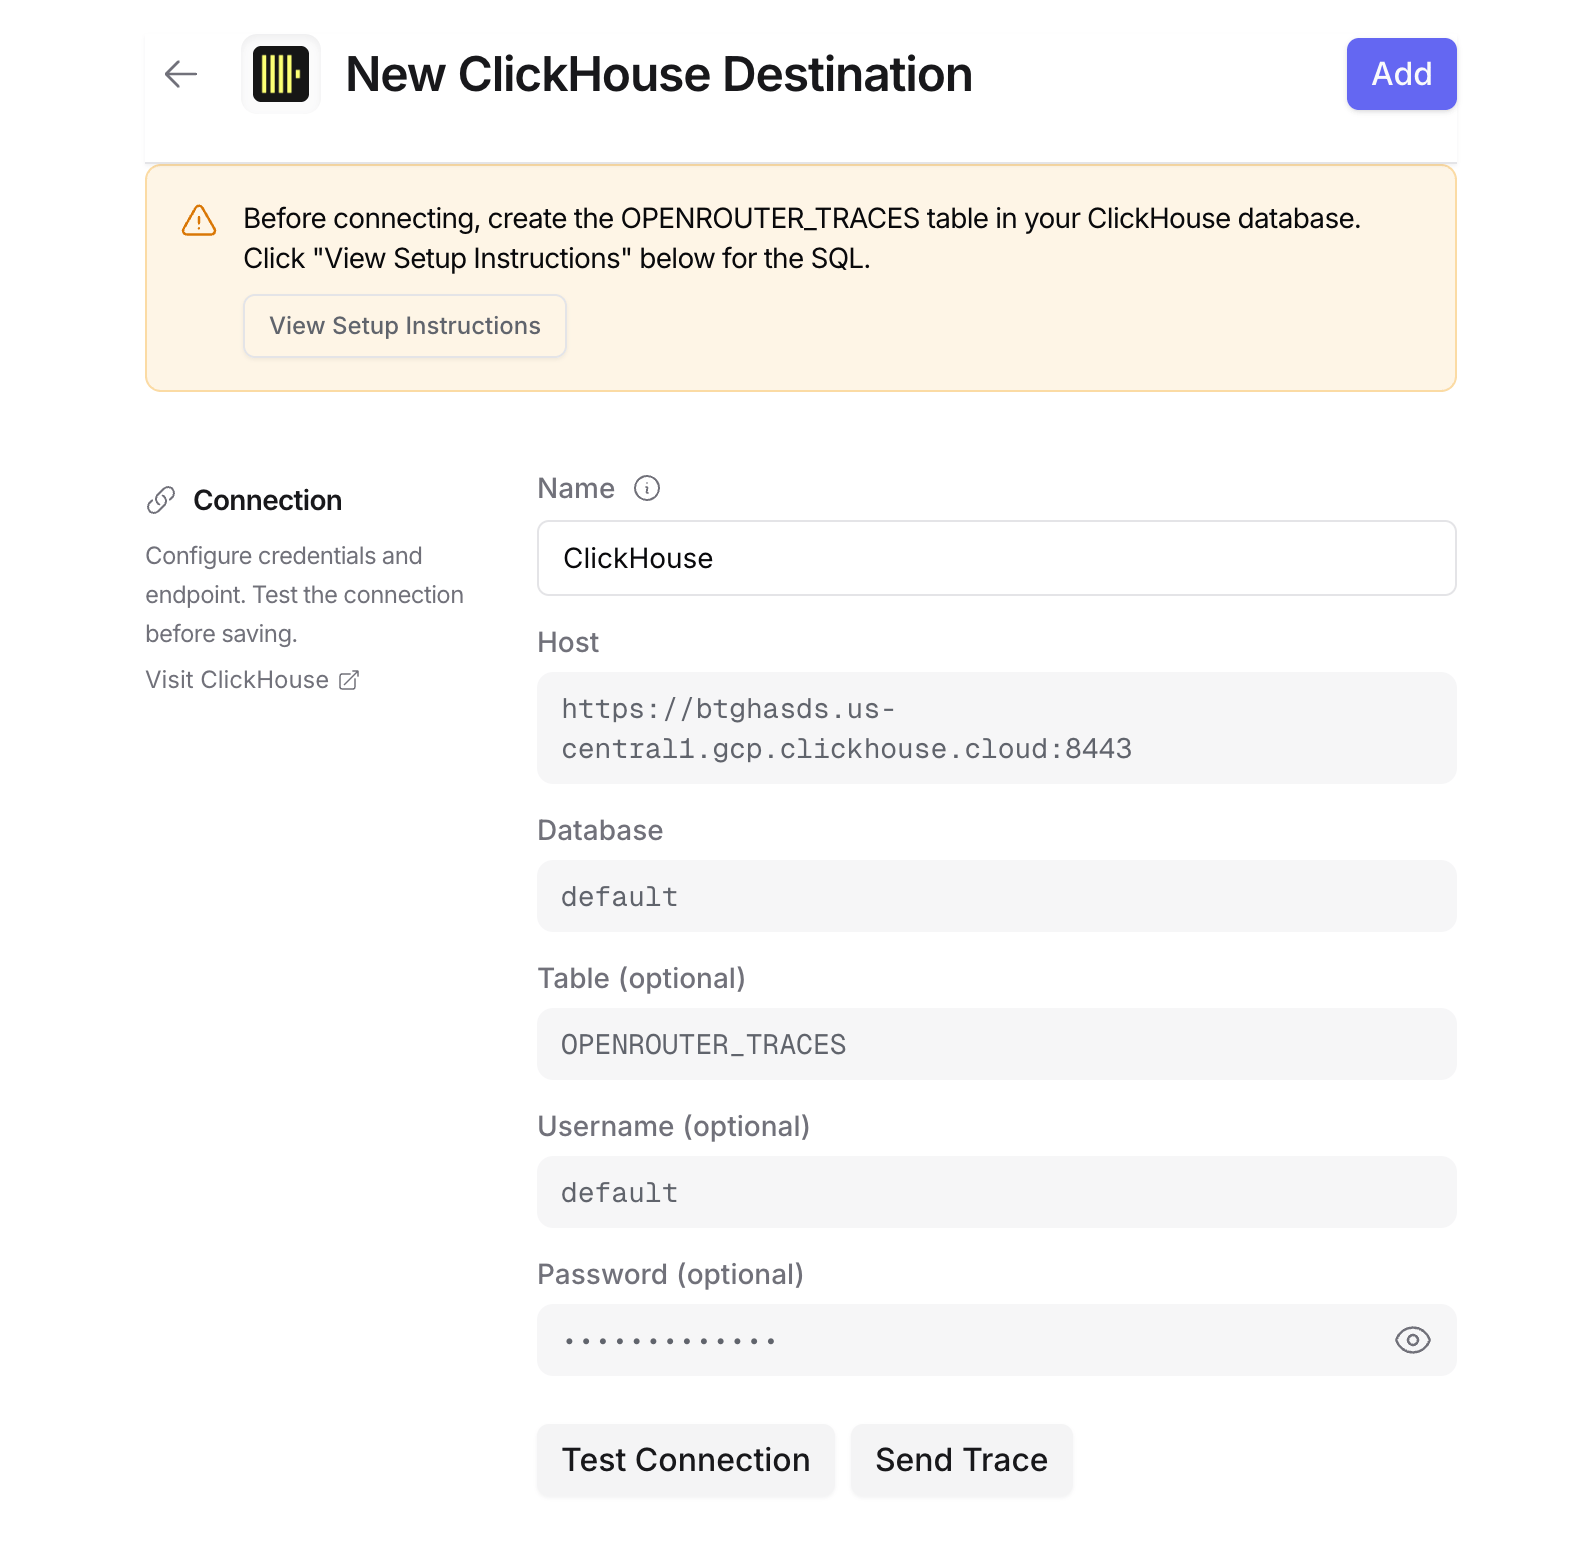 * **Host**: Your ClickHouse HTTP endpoint (e.g., `https://clickhouse.example.com:8123`)
* **Database**: Target database name (default: `default`)
* **Table**: Table name (default: `OPENROUTER_TRACES`)
* **Username**: ClickHouse username for authentication (defaults to `default`)
* **Password**: ClickHouse password for authentication
For ClickHouse Cloud, your host URL is typically `https://{instance}.{region}.clickhouse.cloud:8443`. You can find this in your ClickHouse Cloud console [under **Connect**](https://clickhouse.com/docs/cloud/guides/sql-console/gather-connection-details).
## Step 5: Test and save
Click **Test Connection** to verify the setup. The configuration only saves if the test passes.
## Step 6: Send a test trace
Make an API request through OpenRouter and query your ClickHouse table to verify the trace was received.
## Example queries
### Cost analysis by model
```sql lines theme={null}
SELECT
toDate(TIMESTAMP) as day,
MODEL,
sum(TOTAL_COST) as total_cost,
sum(TOTAL_TOKENS) as total_tokens,
count() as request_count
FROM OPENROUTER_TRACES
WHERE TIMESTAMP >= now() - INTERVAL 30 DAY
AND STATUS = 'ok'
AND SPAN_TYPE = 'GENERATION'
GROUP BY day, MODEL
ORDER BY day DESC, total_cost DESC;
```
### User activity analysis
```sql lines theme={null}
SELECT
USER_ID,
uniqExact(TRACE_ID) as trace_count,
uniqExact(SESSION_ID) as session_count,
sum(TOTAL_TOKENS) as total_tokens,
sum(TOTAL_COST) as total_cost,
avg(DURATION_MS) as avg_duration_ms
FROM OPENROUTER_TRACES
WHERE TIMESTAMP >= now() - INTERVAL 7 DAY
AND SPAN_TYPE = 'GENERATION'
GROUP BY USER_ID
ORDER BY total_cost DESC;
```
### Error analysis
```sql lines theme={null}
SELECT
TRACE_ID,
TIMESTAMP,
MODEL,
LEVEL,
FINISH_REASON,
METADATA,
INPUT,
OUTPUT
FROM OPENROUTER_TRACES
WHERE STATUS = 'error'
AND TIMESTAMP >= now() - INTERVAL 1 HOUR
ORDER BY TIMESTAMP DESC;
```
### Provider performance comparison
```sql lines theme={null}
SELECT
PROVIDER_NAME,
MODEL,
avg(DURATION_MS) as avg_duration_ms,
quantile(0.5)(DURATION_MS) as p50_duration_ms,
quantile(0.95)(DURATION_MS) as p95_duration_ms,
count() as request_count
FROM OPENROUTER_TRACES
WHERE TIMESTAMP >= now() - INTERVAL 7 DAY
AND STATUS = 'ok'
AND SPAN_TYPE = 'GENERATION'
GROUP BY PROVIDER_NAME, MODEL
HAVING request_count >= 10
ORDER BY avg_duration_ms;
```
### Usage by API key
```sql lines theme={null}
SELECT
API_KEY_NAME,
uniqExact(TRACE_ID) as trace_count,
sum(TOTAL_COST) as total_cost,
sum(PROMPT_TOKENS) as prompt_tokens,
sum(COMPLETION_TOKENS) as completion_tokens
FROM OPENROUTER_TRACES
WHERE TIMESTAMP >= now() - INTERVAL 30 DAY
AND SPAN_TYPE = 'GENERATION'
GROUP BY API_KEY_NAME
ORDER BY total_cost DESC;
```
### Accessing JSON columns
ClickHouse stores JSON data as strings. Use `JSONExtract` functions to query
nested fields:
```sql lines theme={null}
SELECT
TRACE_ID,
JSONExtractString(METADATA, 'custom_field') as custom_value,
JSONExtractString(ATTRIBUTES, 'gen_ai.request.model') as requested_model
FROM OPENROUTER_TRACES
WHERE JSONHas(METADATA, 'custom_field');
```
To parse input messages:
```sql lines theme={null}
SELECT
TRACE_ID,
JSONExtractString(
JSONExtractRaw(INPUT, 'messages'),
1, 'role'
) as first_message_role,
JSONExtractString(
JSONExtractRaw(INPUT, 'messages'),
1, 'content'
) as first_message_content
FROM OPENROUTER_TRACES
WHERE SPAN_TYPE = 'GENERATION'
LIMIT 10;
```
## Schema design
### Typed columns
The schema extracts commonly-queried fields as typed columns for efficient filtering and aggregation:
* **Identifiers**: TRACE\_ID, USER\_ID, SESSION\_ID, etc.
* **Timestamps**: DateTime64 for time-series analysis with millisecond precision
* **Model Info**: For cost and performance analysis
* **Metrics**: Tokens and costs for billing
### String columns for JSON
Less commonly-accessed and variable-structure data is stored as JSON strings:
* **ATTRIBUTES**: Full OTEL attribute set
* **INPUT/OUTPUT**: Variable message structures
* **METADATA**: User-defined key-values
* **MODEL\_PARAMETERS**: Model-specific configurations
Use ClickHouse's `JSONExtract*` functions to query these fields.
## Custom Metadata
Custom metadata from the `trace` field is stored in the `METADATA` column as a JSON string. You can query it using ClickHouse's `JSONExtract` functions.
### Supported Metadata Keys
| Key | ClickHouse Mapping | Description |
| ----------------- | ----------------------------------- | ------------------------------------ |
| `trace_id` | `TRACE_ID` column / `METADATA` JSON | Custom trace identifier for grouping |
| `trace_name` | `METADATA` JSON | Custom name for the trace |
| `span_name` | `METADATA` JSON | Name for intermediate spans |
| `generation_name` | `METADATA` JSON | Name for the LLM generation |
### Example
```json lines theme={null}
{
"model": "openai/gpt-4o",
"messages": [{ "role": "user", "content": "Analyze these metrics..." }],
"user": "user_12345",
"session_id": "session_abc",
"trace": {
"trace_name": "Metrics Analysis Pipeline",
"generation_name": "Analyze Trends",
"team": "data-engineering",
"pipeline_version": "2.0",
"data_source": "clickhouse_metrics"
}
}
```
### Querying Custom Metadata
Use ClickHouse's JSON functions to query your custom metadata:
```sql lines theme={null}
SELECT
TRACE_ID,
JSONExtractString(METADATA, 'team') as team,
JSONExtractString(METADATA, 'pipeline_version') as pipeline_version,
JSONExtractString(METADATA, 'data_source') as data_source,
TOTAL_COST,
TOTAL_TOKENS
FROM OPENROUTER_TRACES
WHERE JSONHas(METADATA, 'team')
AND SPAN_TYPE = 'GENERATION'
ORDER BY TIMESTAMP DESC;
```
### Additional Context
* The `user` field maps to the `USER_ID` typed column
* The `session_id` field maps to the `SESSION_ID` typed column
* All custom metadata keys from `trace` are stored in the `METADATA` JSON string column
* For high-performance filtering on metadata fields, consider creating materialized columns with `ALTER TABLE ... ADD COLUMN`
## Additional resources
* [ClickHouse HTTP Interface Documentation](https://clickhouse.com/docs/en/interfaces/http)
* [ClickHouse SQL Reference](https://clickhouse.com/docs/en/sql-reference)
* [ClickHouse Cloud](https://clickhouse.com/cloud)
## Privacy Mode
When [Privacy Mode](/docs/guides/features/broadcast#privacy-mode) is enabled for this destination, prompt and completion content is excluded from traces. All other trace data — token usage, costs, timing, model information, and custom metadata — is still sent normally. See [Privacy Mode](/docs/guides/features/broadcast#privacy-mode) for details.
* **Host**: Your ClickHouse HTTP endpoint (e.g., `https://clickhouse.example.com:8123`)
* **Database**: Target database name (default: `default`)
* **Table**: Table name (default: `OPENROUTER_TRACES`)
* **Username**: ClickHouse username for authentication (defaults to `default`)
* **Password**: ClickHouse password for authentication
For ClickHouse Cloud, your host URL is typically `https://{instance}.{region}.clickhouse.cloud:8443`. You can find this in your ClickHouse Cloud console [under **Connect**](https://clickhouse.com/docs/cloud/guides/sql-console/gather-connection-details).
## Step 5: Test and save
Click **Test Connection** to verify the setup. The configuration only saves if the test passes.
## Step 6: Send a test trace
Make an API request through OpenRouter and query your ClickHouse table to verify the trace was received.
## Example queries
### Cost analysis by model
```sql lines theme={null}
SELECT
toDate(TIMESTAMP) as day,
MODEL,
sum(TOTAL_COST) as total_cost,
sum(TOTAL_TOKENS) as total_tokens,
count() as request_count
FROM OPENROUTER_TRACES
WHERE TIMESTAMP >= now() - INTERVAL 30 DAY
AND STATUS = 'ok'
AND SPAN_TYPE = 'GENERATION'
GROUP BY day, MODEL
ORDER BY day DESC, total_cost DESC;
```
### User activity analysis
```sql lines theme={null}
SELECT
USER_ID,
uniqExact(TRACE_ID) as trace_count,
uniqExact(SESSION_ID) as session_count,
sum(TOTAL_TOKENS) as total_tokens,
sum(TOTAL_COST) as total_cost,
avg(DURATION_MS) as avg_duration_ms
FROM OPENROUTER_TRACES
WHERE TIMESTAMP >= now() - INTERVAL 7 DAY
AND SPAN_TYPE = 'GENERATION'
GROUP BY USER_ID
ORDER BY total_cost DESC;
```
### Error analysis
```sql lines theme={null}
SELECT
TRACE_ID,
TIMESTAMP,
MODEL,
LEVEL,
FINISH_REASON,
METADATA,
INPUT,
OUTPUT
FROM OPENROUTER_TRACES
WHERE STATUS = 'error'
AND TIMESTAMP >= now() - INTERVAL 1 HOUR
ORDER BY TIMESTAMP DESC;
```
### Provider performance comparison
```sql lines theme={null}
SELECT
PROVIDER_NAME,
MODEL,
avg(DURATION_MS) as avg_duration_ms,
quantile(0.5)(DURATION_MS) as p50_duration_ms,
quantile(0.95)(DURATION_MS) as p95_duration_ms,
count() as request_count
FROM OPENROUTER_TRACES
WHERE TIMESTAMP >= now() - INTERVAL 7 DAY
AND STATUS = 'ok'
AND SPAN_TYPE = 'GENERATION'
GROUP BY PROVIDER_NAME, MODEL
HAVING request_count >= 10
ORDER BY avg_duration_ms;
```
### Usage by API key
```sql lines theme={null}
SELECT
API_KEY_NAME,
uniqExact(TRACE_ID) as trace_count,
sum(TOTAL_COST) as total_cost,
sum(PROMPT_TOKENS) as prompt_tokens,
sum(COMPLETION_TOKENS) as completion_tokens
FROM OPENROUTER_TRACES
WHERE TIMESTAMP >= now() - INTERVAL 30 DAY
AND SPAN_TYPE = 'GENERATION'
GROUP BY API_KEY_NAME
ORDER BY total_cost DESC;
```
### Accessing JSON columns
ClickHouse stores JSON data as strings. Use `JSONExtract` functions to query
nested fields:
```sql lines theme={null}
SELECT
TRACE_ID,
JSONExtractString(METADATA, 'custom_field') as custom_value,
JSONExtractString(ATTRIBUTES, 'gen_ai.request.model') as requested_model
FROM OPENROUTER_TRACES
WHERE JSONHas(METADATA, 'custom_field');
```
To parse input messages:
```sql lines theme={null}
SELECT
TRACE_ID,
JSONExtractString(
JSONExtractRaw(INPUT, 'messages'),
1, 'role'
) as first_message_role,
JSONExtractString(
JSONExtractRaw(INPUT, 'messages'),
1, 'content'
) as first_message_content
FROM OPENROUTER_TRACES
WHERE SPAN_TYPE = 'GENERATION'
LIMIT 10;
```
## Schema design
### Typed columns
The schema extracts commonly-queried fields as typed columns for efficient filtering and aggregation:
* **Identifiers**: TRACE\_ID, USER\_ID, SESSION\_ID, etc.
* **Timestamps**: DateTime64 for time-series analysis with millisecond precision
* **Model Info**: For cost and performance analysis
* **Metrics**: Tokens and costs for billing
### String columns for JSON
Less commonly-accessed and variable-structure data is stored as JSON strings:
* **ATTRIBUTES**: Full OTEL attribute set
* **INPUT/OUTPUT**: Variable message structures
* **METADATA**: User-defined key-values
* **MODEL\_PARAMETERS**: Model-specific configurations
Use ClickHouse's `JSONExtract*` functions to query these fields.
## Custom Metadata
Custom metadata from the `trace` field is stored in the `METADATA` column as a JSON string. You can query it using ClickHouse's `JSONExtract` functions.
### Supported Metadata Keys
| Key | ClickHouse Mapping | Description |
| ----------------- | ----------------------------------- | ------------------------------------ |
| `trace_id` | `TRACE_ID` column / `METADATA` JSON | Custom trace identifier for grouping |
| `trace_name` | `METADATA` JSON | Custom name for the trace |
| `span_name` | `METADATA` JSON | Name for intermediate spans |
| `generation_name` | `METADATA` JSON | Name for the LLM generation |
### Example
```json lines theme={null}
{
"model": "openai/gpt-4o",
"messages": [{ "role": "user", "content": "Analyze these metrics..." }],
"user": "user_12345",
"session_id": "session_abc",
"trace": {
"trace_name": "Metrics Analysis Pipeline",
"generation_name": "Analyze Trends",
"team": "data-engineering",
"pipeline_version": "2.0",
"data_source": "clickhouse_metrics"
}
}
```
### Querying Custom Metadata
Use ClickHouse's JSON functions to query your custom metadata:
```sql lines theme={null}
SELECT
TRACE_ID,
JSONExtractString(METADATA, 'team') as team,
JSONExtractString(METADATA, 'pipeline_version') as pipeline_version,
JSONExtractString(METADATA, 'data_source') as data_source,
TOTAL_COST,
TOTAL_TOKENS
FROM OPENROUTER_TRACES
WHERE JSONHas(METADATA, 'team')
AND SPAN_TYPE = 'GENERATION'
ORDER BY TIMESTAMP DESC;
```
### Additional Context
* The `user` field maps to the `USER_ID` typed column
* The `session_id` field maps to the `SESSION_ID` typed column
* All custom metadata keys from `trace` are stored in the `METADATA` JSON string column
* For high-performance filtering on metadata fields, consider creating materialized columns with `ALTER TABLE ... ADD COLUMN`
## Additional resources
* [ClickHouse HTTP Interface Documentation](https://clickhouse.com/docs/en/interfaces/http)
* [ClickHouse SQL Reference](https://clickhouse.com/docs/en/sql-reference)
* [ClickHouse Cloud](https://clickhouse.com/cloud)
## Privacy Mode
When [Privacy Mode](/docs/guides/features/broadcast#privacy-mode) is enabled for this destination, prompt and completion content is excluded from traces. All other trace data — token usage, costs, timing, model information, and custom metadata — is still sent normally. See [Privacy Mode](/docs/guides/features/broadcast#privacy-mode) for details.