> ## Documentation Index
> Fetch the complete documentation index at: https://openrouter.ai/docs/llms.txt
> Use this file to discover all available pages before exploring further.
# DevTools
> SDK Development Tools for telemetry capture and visualization
The DevTools telemetry hooks and viewer are currently pre-release. There is no complete supported public client integration yet: `@openrouter/sdk` cannot attach the DevTools hooks through its typed public options, and `@openrouter/agent` `callModel` uses streaming Responses API output that DevTools cannot currently complete or normalize. See [Client Compatibility](#client-compatibility) below. DevTools is designed for development use only and should never be deployed in production environments.
The OpenRouter DevTools include pre-release telemetry hooks and a viewer for compatible telemetry files.
## Why use DevTools?
Building with AI SDKs requires visibility into what's happening under the hood. The DevTools viewer helps inspect telemetry produced by a compatible integration.
**Two main components:**
1. **SDK Telemetry Hooks** - Normalize supported operations into the DevTools telemetry format
2. **DevTools Viewer** - Beautiful web UI for visualizing captured telemetry data
## Key Features
### SDK DevTools Viewer
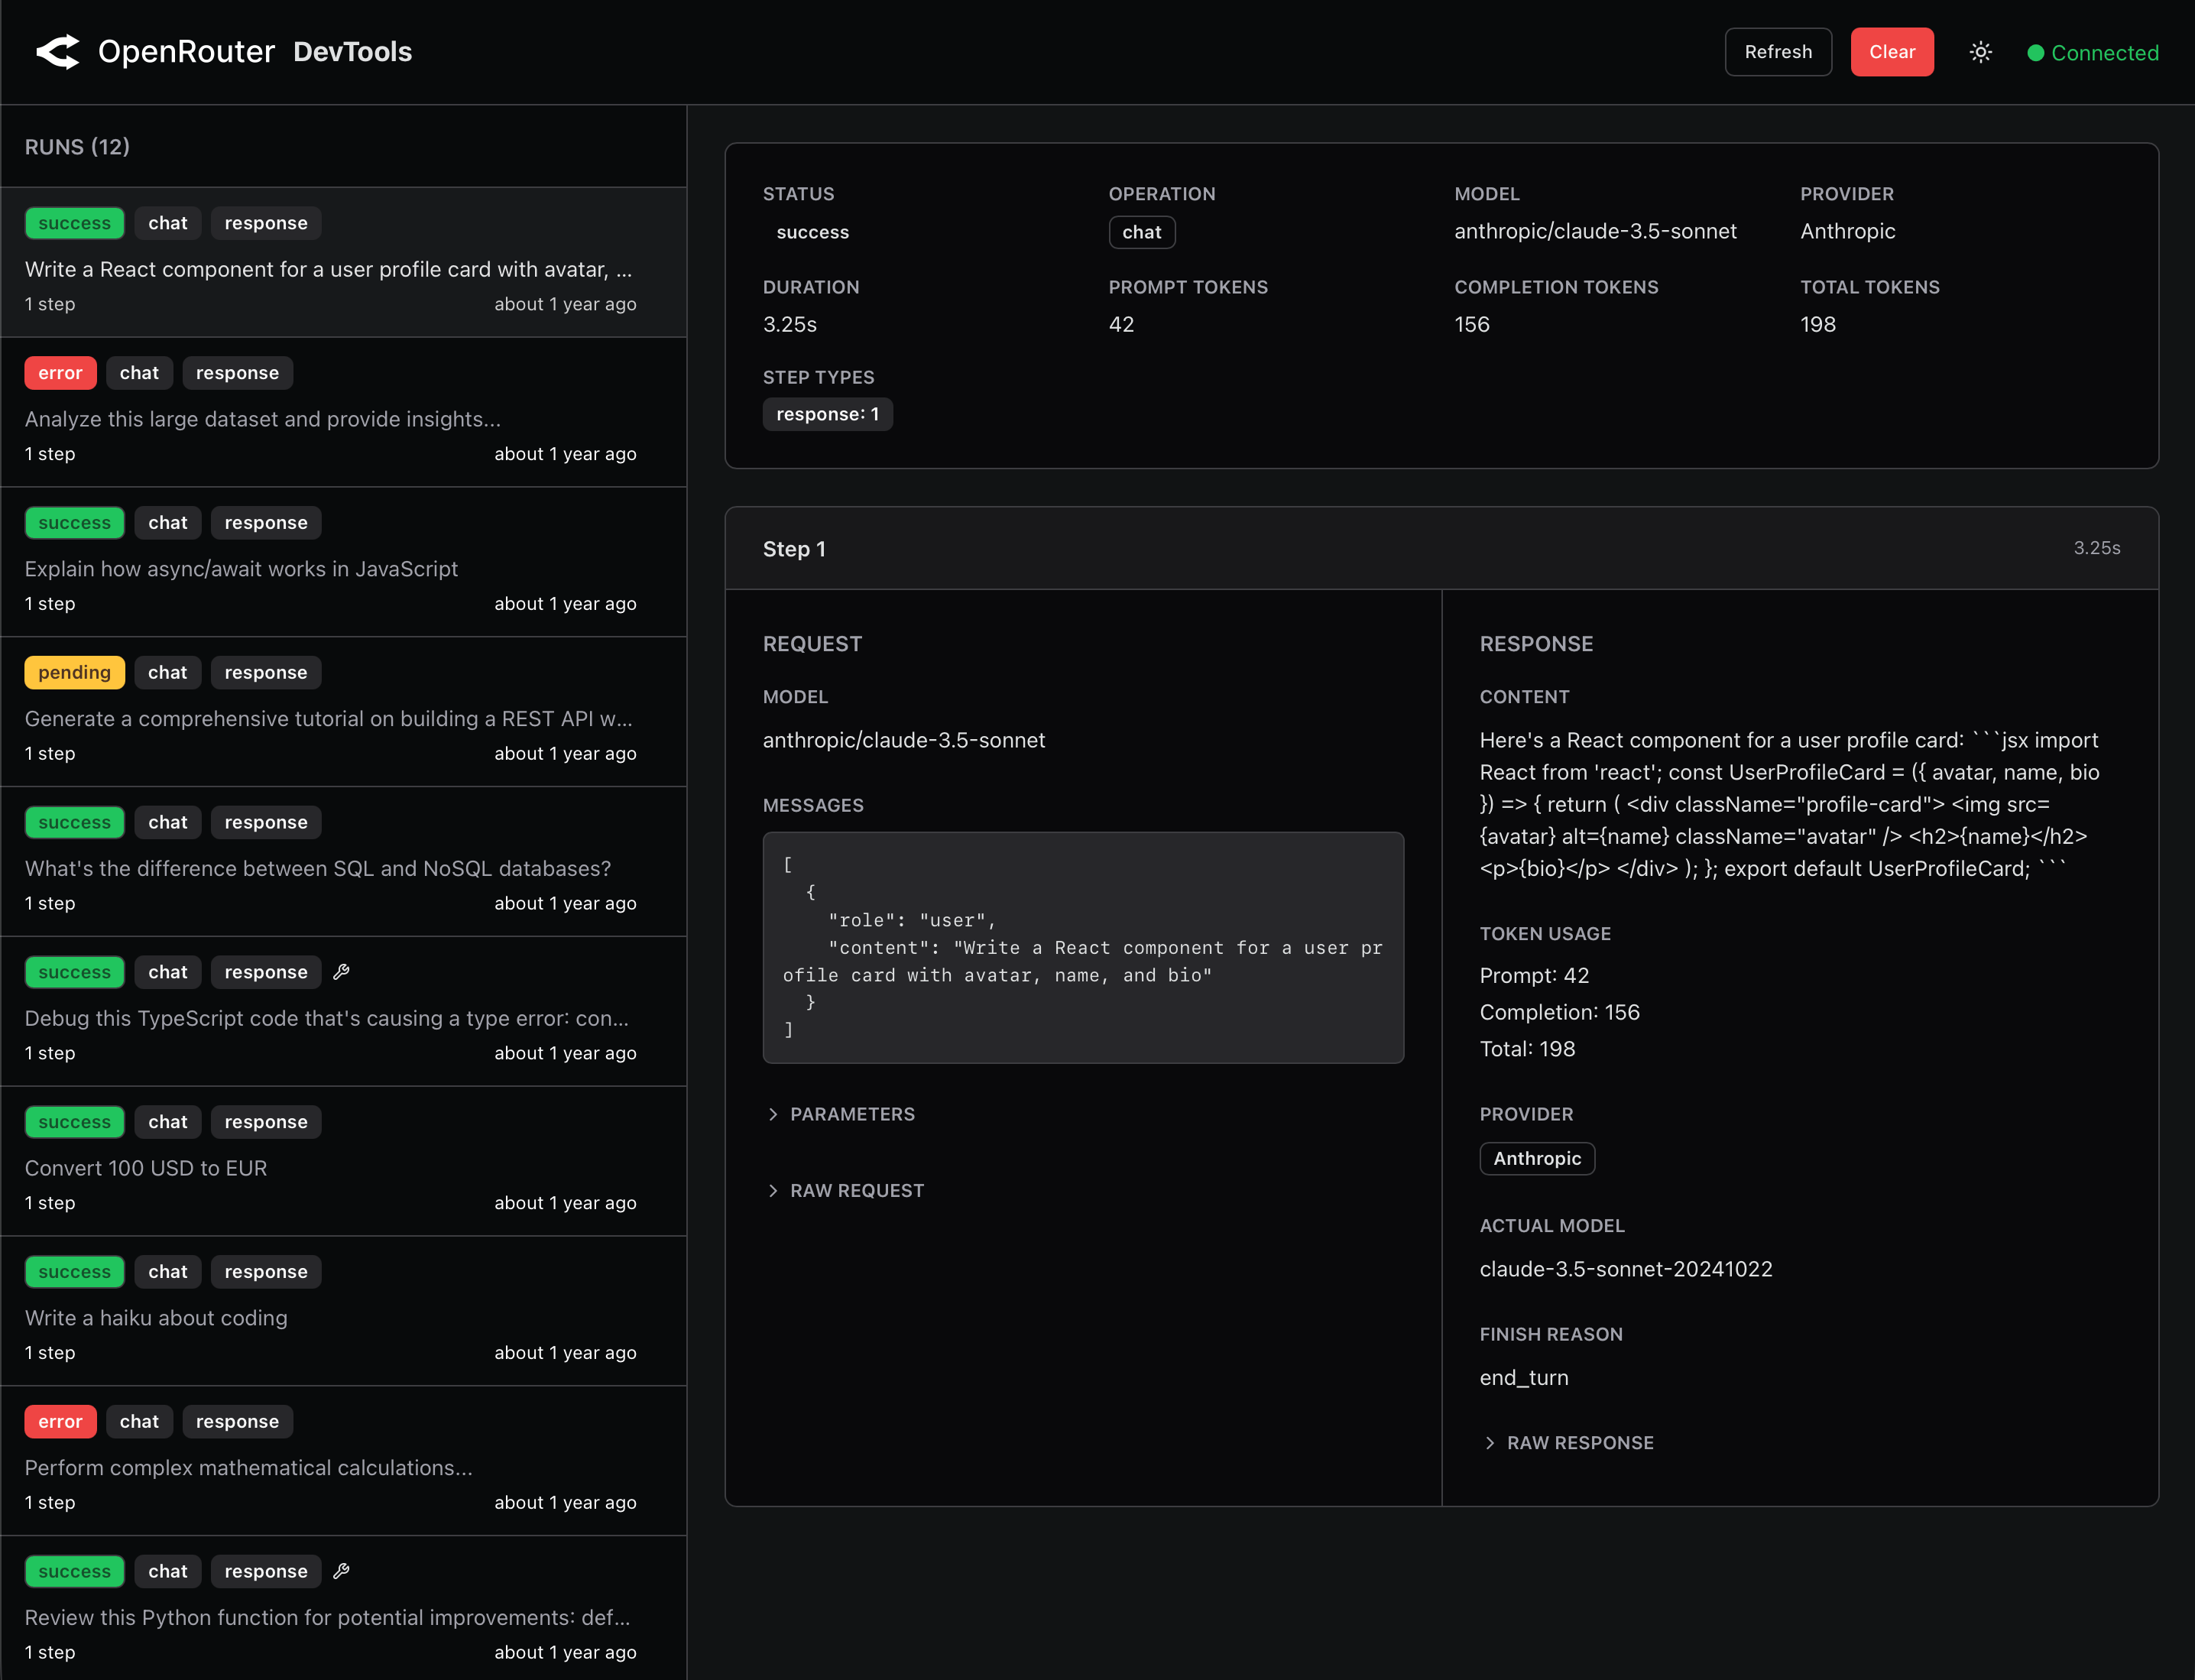
Launch a web-based interface to visualize your SDK telemetry:
* **Run tracking** - View operations from an existing compatible telemetry file
* **Detailed step analysis** - Inspect request/response data, timing, and errors for each step
* **Token usage insights** - Track prompt and completion tokens across all requests
* **Error debugging** - Easily identify and debug failed requests with full error details
* **Dark/Light mode** - Full theme support with automatic system preference detection
 ### SDK Telemetry Hooks
For compatible operations that complete successfully, the hooks record:
* Request and response data
* Token usage
* Timing information for performance analysis
* Errors and failure modes
* Model information
## Installation
Install the DevTools package as a development dependency:
```bash title="npm" lines theme={null}
npm install --save-dev @openrouter/devtools
```
```bash title="pnpm" lines theme={null}
pnpm add -D @openrouter/devtools
```
```bash title="yarn" lines theme={null}
yarn add -D @openrouter/devtools
```
```bash title="bun" lines theme={null}
bun add -d @openrouter/devtools
```
```bash title="deno" lines theme={null}
deno add --dev npm:@openrouter/devtools
```
Install the CLI that provides the `openrouter devtools` command:
```bash lines theme={null}
npm install --global @openrouter/cli
```
**Important:** DevTools is designed for development only. It will throw an error if `NODE_ENV === 'production'` to prevent accidental production deployment.
## Client Compatibility
There is currently no complete supported public client integration. The generated `@openrouter/sdk` client cannot attach the plain DevTools hook object through its typed public constructor options.
The Agent SDK is not an alternative Client SDK setup. Although `@openrouter/agent` accepts the hooks, its `callModel` method always uses a streaming Responses API request. DevTools currently attempts to parse the response as JSON, does not parse the SSE stream, and does not normalize the Responses API request or response schema.
## Quick Start - DevTools Viewer
From a project containing an existing compatible `.devtools/openrouter-generations.json` file, launch the DevTools web interface:
```bash lines theme={null}
openrouter devtools
```
This starts a local server on port 4983. Open `http://localhost:4983` in your browser to view:
* All SDK runs with timestamps and status
* Step-by-step request/response details
* Token usage
* Error messages and stack traces
* Performance timing information
The viewer automatically refreshes when new telemetry data is captured.
## How It Works
### Telemetry Capture Flow
With a compatible hook integration:
1. SDK hooks intercept requests before they're sent
2. Hook processing parses the request or response body
3. Data is stored in `.devtools/openrouter-generations.json`
4. A notification is sent to the local DevTools server (if running)
5. The DevTools viewer updates in real-time
### Failure Isolation
* **Request preservation** - Hooks return the original SDK request or response
* **Graceful degradation** - Capture errors are swallowed instead of replacing the SDK result
* **Hook overhead** - Body parsing runs inside the SDK hook lifecycle; capture is not zero-cost
* **Development-only** - Throws error if used in production (`NODE_ENV === 'production'`)
### Storage Location
By default, telemetry is stored in:
```lines theme={null}
.devtools/openrouter-generations.json
```
This file contains:
* **Runs** - Top-level tracking of SDK operations
* **Steps** - Individual request/response pairs within each run
* **Metadata** - Timestamps, status, token usage, errors
## Configuration Options
### Hook Configuration
When calling `createOpenRouterDevtools()`, you can customize:
| Option | Type | Default | Description |
| ------------- | -------- | ----------------------------------------- | ------------------------------------- |
| `storagePath` | `string` | `'.devtools/openrouter-generations.json'` | Where to store captured telemetry |
| `serverUrl` | `string` | `'http://localhost:4983/api/notify'` | DevTools server notification endpoint |
### DevTools Server Configuration
The DevTools viewer runs on port 4983 by default. Set `OPENROUTER_DEVTOOLS_PORT` when launching the CLI to use a different port:
```bash lines theme={null}
OPENROUTER_DEVTOOLS_PORT=5000 openrouter devtools
```
## Recognized Operation IDs
The hooks recognize these internal SDK operation IDs:
* `createResponses` - Responses API calls
* `sendChatCompletionRequest` - Chat completions API calls
This is not a list of working public client integrations. The Agent SDK reaches `createResponses`, but its streaming response is unsupported. The generated Client SDK reaches `sendChatCompletionRequest`, but it cannot attach the plain hooks through its typed public options. All other SDK operations, including embeddings, are ignored.
## Data Captured Per Step
For each compatible operation that completes successfully, DevTools captures:
**Request Data:**
* Model name
* Messages/prompts
* Parameters (temperature, max\_tokens, etc.)
**Response Data:**
* Generated content
* Token usage (prompt + completion tokens)
* Provider and model used
* Finish reason
**Metadata:**
* Start and completion timestamps
* Duration in milliseconds
* Status (success, error, in\_progress)
* Error details (if failed)
## Safety & Best Practices
### Production Environment Protection
Creating DevTools hooks throws an error when `NODE_ENV === 'production'`. Only initialize the package in a development environment and only from a compatible integration.
### Capture Failure Isolation
* Hook body parsing is awaited by the SDK hook lifecycle
* DevTools capture errors do not replace your SDK result
* Failed writes are silently ignored and don't break your application
### Error Handling
DevTools catches failures in request parsing, response parsing, storage, and server notification. A capture failure can leave telemetry missing or incomplete, but it does not replace the SDK request or response.
## Troubleshooting
### Port Already in Use
If port 4983 is already in use:
```bash lines theme={null}
Error: listen EADDRINUSE: address already in use :::4983
```
**Solution:** Either stop the process using port 4983, or launch the viewer with a different port:
```bash lines theme={null}
OPENROUTER_DEVTOOLS_PORT=5000 openrouter devtools
```
If you maintain a compatible hook integration, update its notification configuration:
```typescript lines theme={null}
createOpenRouterDevtools({
serverUrl: 'http://localhost:5000/api/notify'
})
```
### Storage Location Issues
If you can't find the telemetry file:
1. Check the default location: `.devtools/openrouter-generations.json`
2. Ensure you have write permissions in your working directory
3. Check for custom `storagePath` configuration
### DevTools Viewer Not Updating
If the viewer doesn't show new requests:
1. Verify the DevTools server is running (`openrouter devtools`)
2. Check that `serverUrl` matches the DevTools server port
3. Ensure the telemetry file is being written (check `.devtools/` directory)
4. Try refreshing the browser manually
### Common Setup Issues
**Issue:** DevTools package not found
```bash lines theme={null}
Cannot find module '@openrouter/devtools'
```
**Solution:** Install the package:
```bash title="npm" lines theme={null}
npm install --save-dev @openrouter/devtools
```
```bash title="pnpm" lines theme={null}
pnpm add -D @openrouter/devtools
```
```bash title="yarn" lines theme={null}
yarn add -D @openrouter/devtools
```
```bash title="bun" lines theme={null}
bun add -d @openrouter/devtools
```
```bash title="deno" lines theme={null}
deno add --dev npm:@openrouter/devtools
```
***
**Issue:** Accidental production usage
```bash lines theme={null}
Error: DevTools should not be used in production
```
**Solution:** Initialize the hook package only in a development environment and only from a compatible integration.
### SDK Telemetry Hooks
For compatible operations that complete successfully, the hooks record:
* Request and response data
* Token usage
* Timing information for performance analysis
* Errors and failure modes
* Model information
## Installation
Install the DevTools package as a development dependency:
```bash title="npm" lines theme={null}
npm install --save-dev @openrouter/devtools
```
```bash title="pnpm" lines theme={null}
pnpm add -D @openrouter/devtools
```
```bash title="yarn" lines theme={null}
yarn add -D @openrouter/devtools
```
```bash title="bun" lines theme={null}
bun add -d @openrouter/devtools
```
```bash title="deno" lines theme={null}
deno add --dev npm:@openrouter/devtools
```
Install the CLI that provides the `openrouter devtools` command:
```bash lines theme={null}
npm install --global @openrouter/cli
```
**Important:** DevTools is designed for development only. It will throw an error if `NODE_ENV === 'production'` to prevent accidental production deployment.
## Client Compatibility
There is currently no complete supported public client integration. The generated `@openrouter/sdk` client cannot attach the plain DevTools hook object through its typed public constructor options.
The Agent SDK is not an alternative Client SDK setup. Although `@openrouter/agent` accepts the hooks, its `callModel` method always uses a streaming Responses API request. DevTools currently attempts to parse the response as JSON, does not parse the SSE stream, and does not normalize the Responses API request or response schema.
## Quick Start - DevTools Viewer
From a project containing an existing compatible `.devtools/openrouter-generations.json` file, launch the DevTools web interface:
```bash lines theme={null}
openrouter devtools
```
This starts a local server on port 4983. Open `http://localhost:4983` in your browser to view:
* All SDK runs with timestamps and status
* Step-by-step request/response details
* Token usage
* Error messages and stack traces
* Performance timing information
The viewer automatically refreshes when new telemetry data is captured.
## How It Works
### Telemetry Capture Flow
With a compatible hook integration:
1. SDK hooks intercept requests before they're sent
2. Hook processing parses the request or response body
3. Data is stored in `.devtools/openrouter-generations.json`
4. A notification is sent to the local DevTools server (if running)
5. The DevTools viewer updates in real-time
### Failure Isolation
* **Request preservation** - Hooks return the original SDK request or response
* **Graceful degradation** - Capture errors are swallowed instead of replacing the SDK result
* **Hook overhead** - Body parsing runs inside the SDK hook lifecycle; capture is not zero-cost
* **Development-only** - Throws error if used in production (`NODE_ENV === 'production'`)
### Storage Location
By default, telemetry is stored in:
```lines theme={null}
.devtools/openrouter-generations.json
```
This file contains:
* **Runs** - Top-level tracking of SDK operations
* **Steps** - Individual request/response pairs within each run
* **Metadata** - Timestamps, status, token usage, errors
## Configuration Options
### Hook Configuration
When calling `createOpenRouterDevtools()`, you can customize:
| Option | Type | Default | Description |
| ------------- | -------- | ----------------------------------------- | ------------------------------------- |
| `storagePath` | `string` | `'.devtools/openrouter-generations.json'` | Where to store captured telemetry |
| `serverUrl` | `string` | `'http://localhost:4983/api/notify'` | DevTools server notification endpoint |
### DevTools Server Configuration
The DevTools viewer runs on port 4983 by default. Set `OPENROUTER_DEVTOOLS_PORT` when launching the CLI to use a different port:
```bash lines theme={null}
OPENROUTER_DEVTOOLS_PORT=5000 openrouter devtools
```
## Recognized Operation IDs
The hooks recognize these internal SDK operation IDs:
* `createResponses` - Responses API calls
* `sendChatCompletionRequest` - Chat completions API calls
This is not a list of working public client integrations. The Agent SDK reaches `createResponses`, but its streaming response is unsupported. The generated Client SDK reaches `sendChatCompletionRequest`, but it cannot attach the plain hooks through its typed public options. All other SDK operations, including embeddings, are ignored.
## Data Captured Per Step
For each compatible operation that completes successfully, DevTools captures:
**Request Data:**
* Model name
* Messages/prompts
* Parameters (temperature, max\_tokens, etc.)
**Response Data:**
* Generated content
* Token usage (prompt + completion tokens)
* Provider and model used
* Finish reason
**Metadata:**
* Start and completion timestamps
* Duration in milliseconds
* Status (success, error, in\_progress)
* Error details (if failed)
## Safety & Best Practices
### Production Environment Protection
Creating DevTools hooks throws an error when `NODE_ENV === 'production'`. Only initialize the package in a development environment and only from a compatible integration.
### Capture Failure Isolation
* Hook body parsing is awaited by the SDK hook lifecycle
* DevTools capture errors do not replace your SDK result
* Failed writes are silently ignored and don't break your application
### Error Handling
DevTools catches failures in request parsing, response parsing, storage, and server notification. A capture failure can leave telemetry missing or incomplete, but it does not replace the SDK request or response.
## Troubleshooting
### Port Already in Use
If port 4983 is already in use:
```bash lines theme={null}
Error: listen EADDRINUSE: address already in use :::4983
```
**Solution:** Either stop the process using port 4983, or launch the viewer with a different port:
```bash lines theme={null}
OPENROUTER_DEVTOOLS_PORT=5000 openrouter devtools
```
If you maintain a compatible hook integration, update its notification configuration:
```typescript lines theme={null}
createOpenRouterDevtools({
serverUrl: 'http://localhost:5000/api/notify'
})
```
### Storage Location Issues
If you can't find the telemetry file:
1. Check the default location: `.devtools/openrouter-generations.json`
2. Ensure you have write permissions in your working directory
3. Check for custom `storagePath` configuration
### DevTools Viewer Not Updating
If the viewer doesn't show new requests:
1. Verify the DevTools server is running (`openrouter devtools`)
2. Check that `serverUrl` matches the DevTools server port
3. Ensure the telemetry file is being written (check `.devtools/` directory)
4. Try refreshing the browser manually
### Common Setup Issues
**Issue:** DevTools package not found
```bash lines theme={null}
Cannot find module '@openrouter/devtools'
```
**Solution:** Install the package:
```bash title="npm" lines theme={null}
npm install --save-dev @openrouter/devtools
```
```bash title="pnpm" lines theme={null}
pnpm add -D @openrouter/devtools
```
```bash title="yarn" lines theme={null}
yarn add -D @openrouter/devtools
```
```bash title="bun" lines theme={null}
bun add -d @openrouter/devtools
```
```bash title="deno" lines theme={null}
deno add --dev npm:@openrouter/devtools
```
***
**Issue:** Accidental production usage
```bash lines theme={null}
Error: DevTools should not be used in production
```
**Solution:** Initialize the hook package only in a development environment and only from a compatible integration.